Getting Started Series: Using Dashboards Follow
Dashboards are simply a way to display multiple reports at once. Dashboards are made up of components and the relationship between a component and report is 1:1; for each dashboard component, there is a single report.
Combining multiple reports together on a single dashboard page layout creates powerful visual displays which provide a way to consume several reports at once. These dashboard pages typically have a common theme, like sales performance, inventory management, etc.
Using Dashboards
Dashboards can be viewed by clicking the Dashboards tab at the top of your screen. From here you can select dashboards to view or edit, as well as create new dashboards.

Creating a Dashboard
- From home, click the Dashboards tab.
- Click New Dashboard.

- Name your dashboard, write a description (optional) and select a folder.
- Click Create.
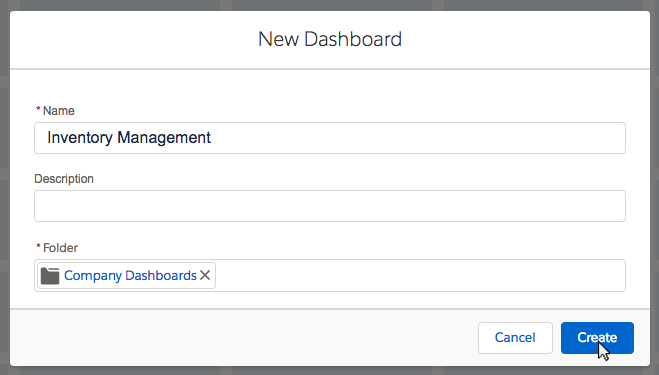
Now that we have a fresh dashboard, let's add some components!
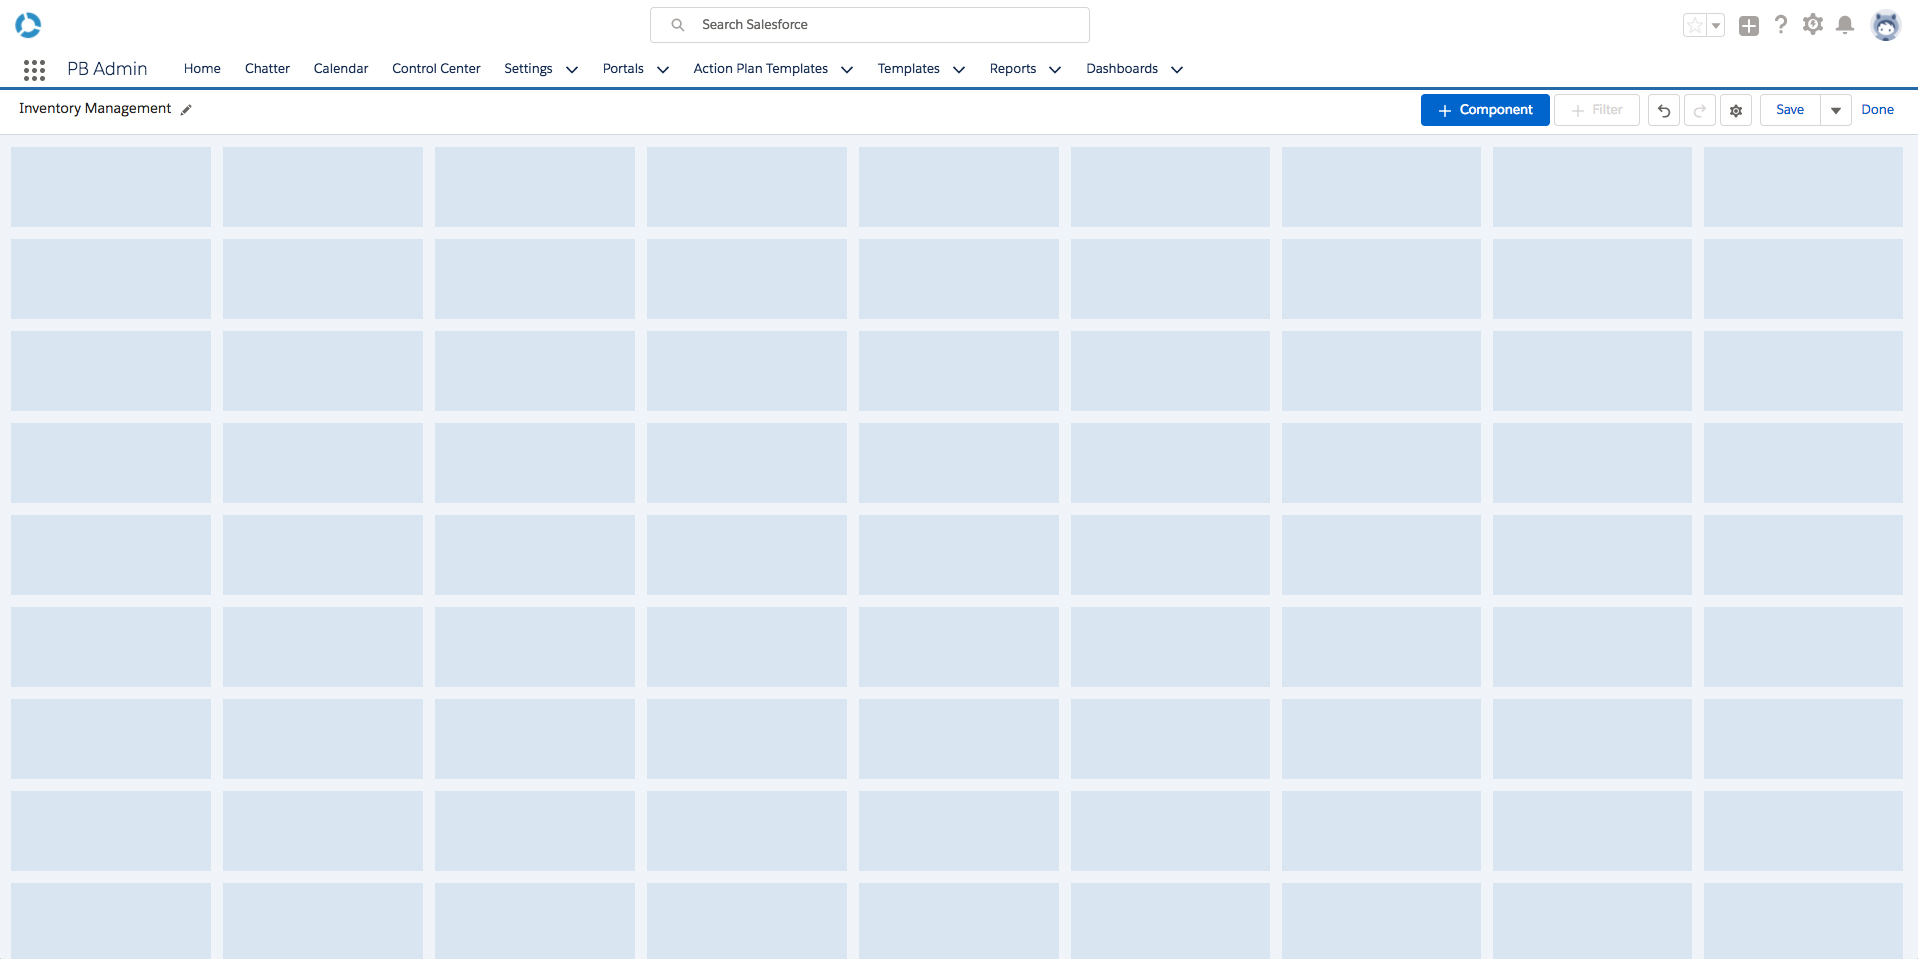
- Click '+ Component' at the top of the screen.

In this example, our dashboard theme will be Inventory Management. Let's search for reports related to Listings.
- Type 'Listings' in the search box and select the 'Listings by Status' report.
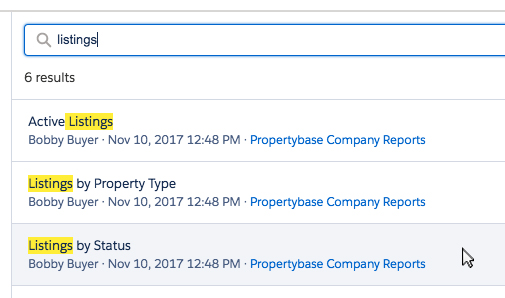
- Click Select.

On the 'Add Component' page you can modify how the data is displayed for a particular component.
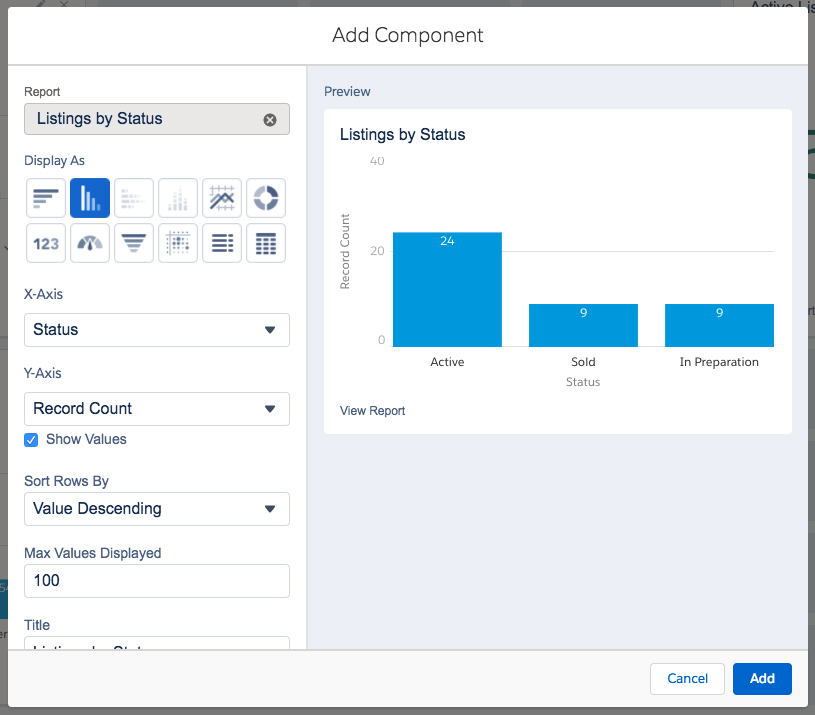
- Click Add once your are satisfied with the appearance of your report.
- Continue adding components until you are satisfied with your dashboard.
Tip: You can use Control + Z (PC) or Command + Z (Mac) to undo changes to your Dashboard.
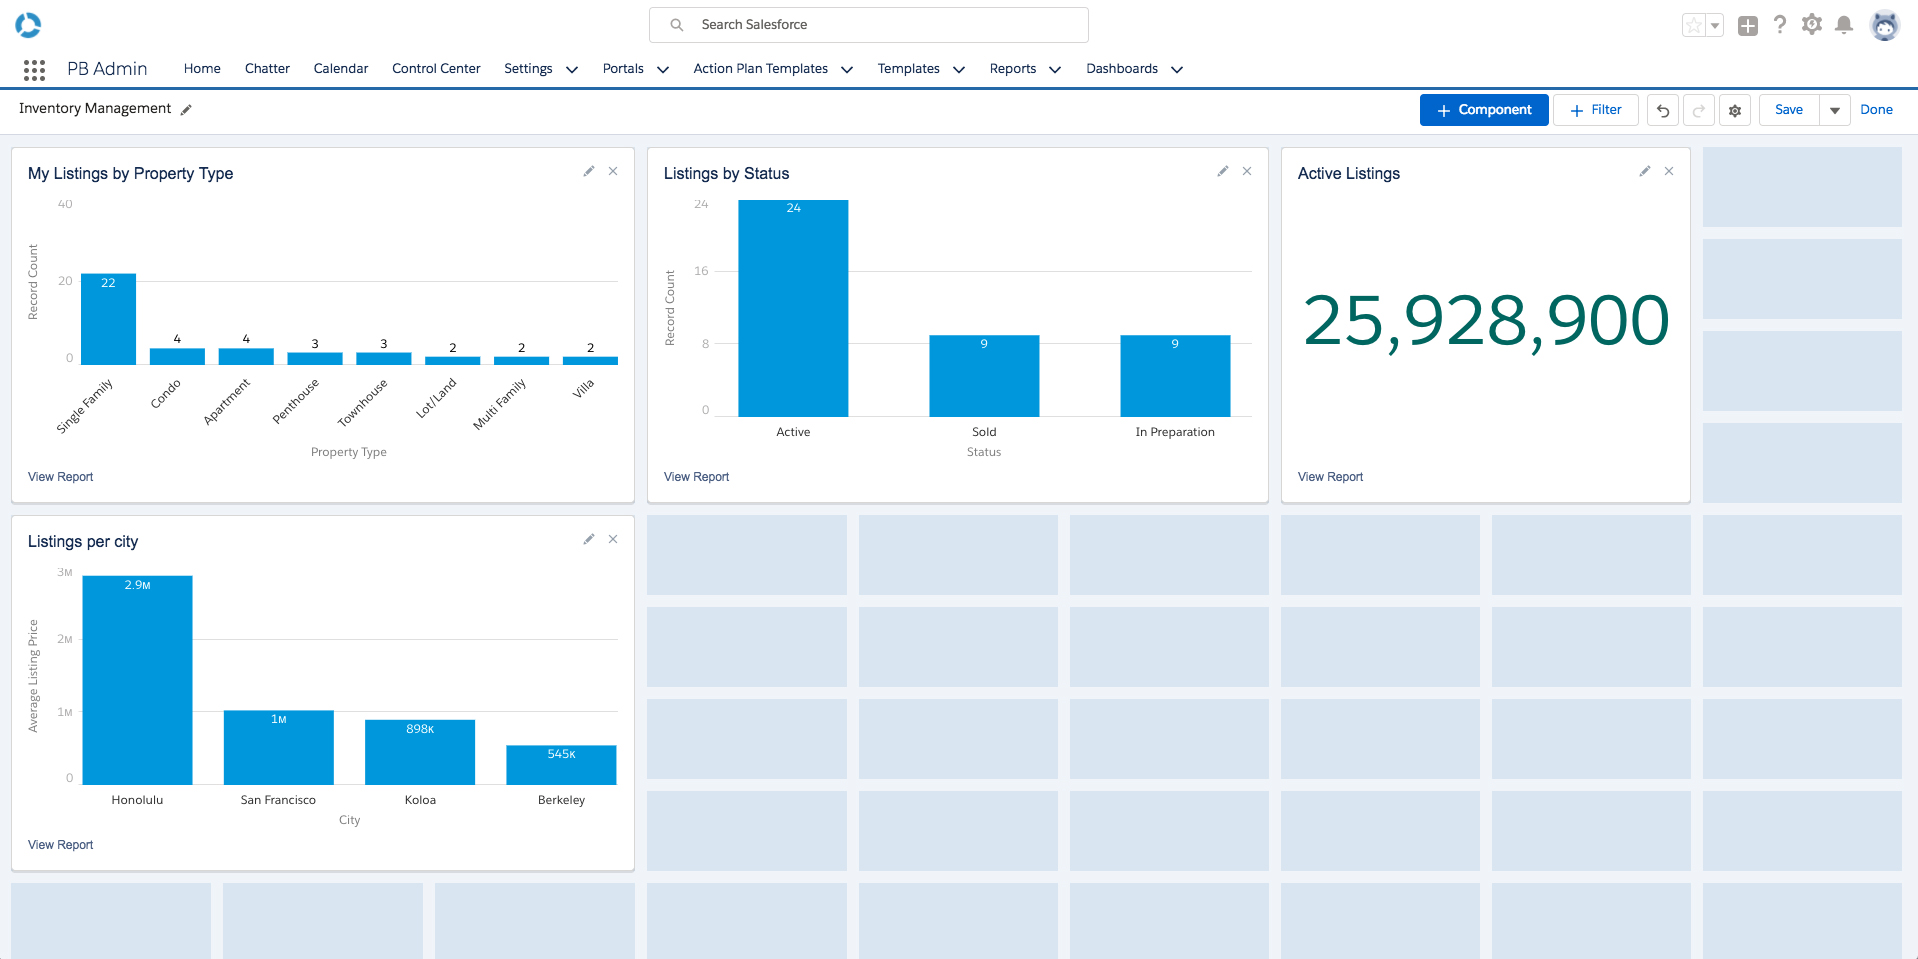
- When you are finished click Done in the top right corner, then click Save.
Nice work! You just built a custom dashboard in Propertybase.
Click here to learn how to add dashboards to your organization's homepage.
This is Part 12 of 12 in our Getting Started with Propertybase series. We recommend you to follow along from the beginning, in order, as we walk through the entire Propertybase process, from lead to close.


Comments
0 comments
Article is closed for comments.