

Getting Started Series: Using Reports Follow

Using Propertybase to streamline your business and manage your data will help you work faster and more efficiently - but what about insights? Do you have questions about your business that you would like to answer? These answers can be found using the reporting tools that come standard in Propertybase. Viewing business data visually - using charts and graphs - makes it easier to gain insights compared to spreadsheets and numbers alone.
What is a Report?
A report is a list of records that meet the criteria you define. It’s displayed in Propertybase in rows and columns, and can be filtered, grouped and displayed visually.
Every report is stored in a folder. Folders can be public, hidden, or shared, and can be set to read-only or read/write. You control who has access to the contents of the folder based on roles and permissions. You can make a folder available to your entire organization, or make it private so that only the owner has access.
For a full guide and walk through we always suggest doing the Salesforce Trailhead on this topic, as this is a very large piece of the application.
https://trailhead.salesforce.com/en/modules/lex_implementation_reports_dashboards
Defining Report Criteria
When building a custom report, it's important to clearly define the question you are trying to answer. Before building a report, ask yourself (or whoever is requesting the report) that question, ask follow-up questions, write requirements and then map those requirements to report criteria. For example:
| Type of Information | Examples |
| Original Question | How many contacts do I have per stage? |
| Follow-up Questions |
|
| Requirements |
|
| Criteria |
|
When you create a report in Propertybase, the criteria you enter is essentially the question you're asking and the results returned are the answer. However, in order to ask the question you have to speak the database's language. No worries! Propertybase comes with a built-in translator, allowing you to ask the database all the questions you want through a point-and-click interface.
Selecting a Report Type
Before we can start building our report, we must select a report type. This is one of the most important steps in building a report. When you pick a report type, you’re picking the records and fields you’ll be able to see in your report. Each report type has a primary object and one or more related objects. For standard report types, you will typically see this represented in the report type name. For example, with the "Contacts & Accounts" report type, "Contacts" is the primary object and "Accounts" is the related object.
Pay close attention to the primary object and the related object criteria when you’re selecting a report type. Don’t see the fields you want? You may need to create a new custom report type, or adjust an existing custom report type to add or hide fields.
In this article we are going to keep it simple and select "Contacts & Companies" for our report type.
Building a Report
Note: The following section uses the Lightning Report Builder. Click here to enable this feature.
- From home, click the Reports tab.
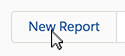
- Click New Report.
- Select Contacts & Companies as the report type.
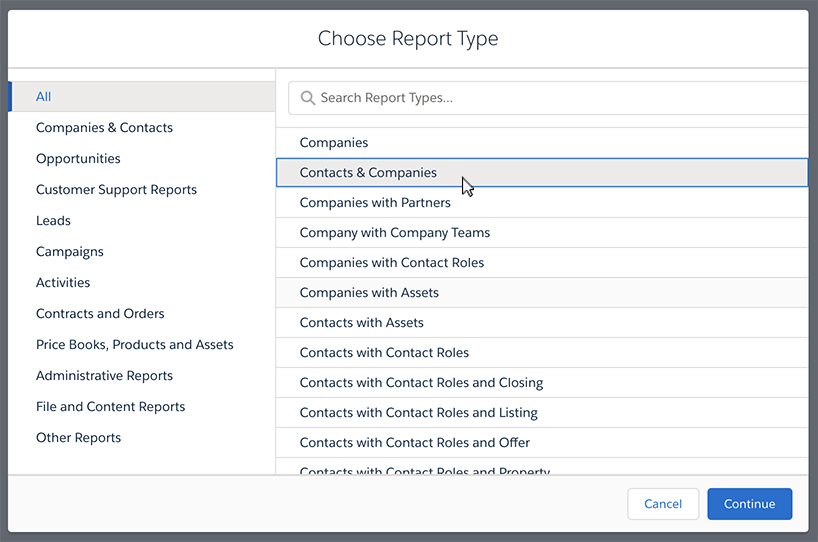
- Click Continue.
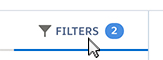
- Click the Filters tab.
- Select the Created Date filter.
- Change Range to All Time.
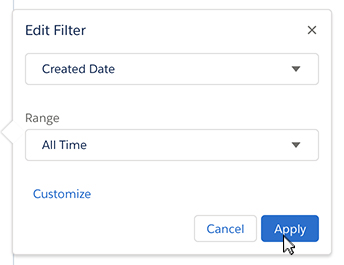
- Click Apply.
Next we will remove unnecessary columns and group our results by stage.
- Click the Outline tab.
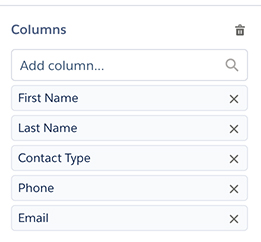
- Remove and add columns until it looks like the image below.
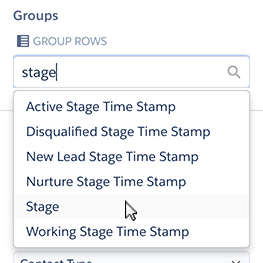
- Click the text box that says "Add group..." and select Stage.
Almost there! Let's finish up by adding a visual component to our report.
- Click Add Chart in the top menu.
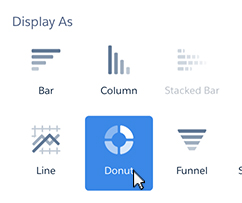
- Click the gear icon to the right of the chart.
- Select Donut (or whichever chart you prefer.)
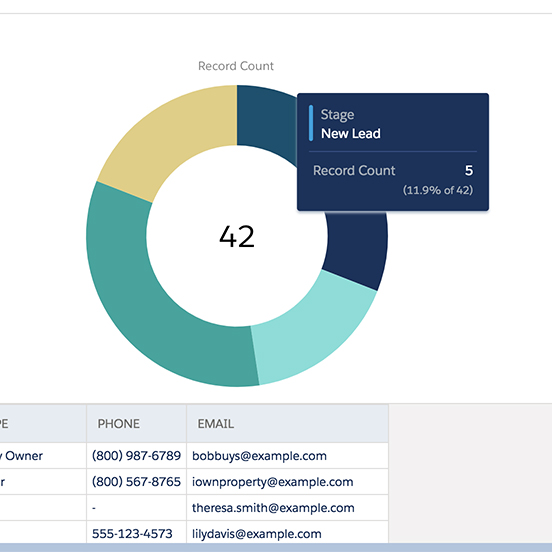
- Click Run in the top right corner.
Congrats! You just created a custom report that shows all contacts grouped by stage.
This is Part 11 of 12 in our Getting Started with Propertybase series. We recommend you continue to follow along, in order, as we walk through the entire Propertybase process, from lead to close.
Getting Started with Propertybase: Table of Contents
Next Up: Using Dashboards
Thus conludes the Reporting Basics part of the Getting Started with Propertybase series. In the next section we will learn about combining multiple reports and displaying them using Dashboards.
Comments
0 comments
Article is closed for comments.