Core Feature: Using Reports Follow
Reporting in Propertybase allows you to gain valuable insights about your business. Once you understand this powerful feature, you'll have the power to answer specific questions like, "Who should I call today?", "On average, how quickly do I respond to new leads?", etc. Viewing data about your business visually makes it easier to gain insights compared to spreadsheets and raw numbers alone.
A report is simply a list of records, filtered by fields and predetermined criteria. Once a report has been created, a number of visualization options are available to make consuming the report data as simple as possible. You can even subscribe to a report and receive regular updates straight to your inbox. There is no limit to the number of reports that you can create!
Accessing Reports
Reports can be accessed through the main navigation menu by clicking the Reports tab. If you don't see this tab, you can also access Reports by clicking the app launcher on the far left side of the navigation and selecting it from the list of features.

Individual records for Reports can also be accessed by clicking the arrow in the Reports tab and selecting a record. In the Reports example below, we haven't accessed a Report recently, so no records are displayed.

Clicking the Reports tab will bring you to the most recent Reports screen. On this screen you will see Reports that you have viewed recently. To view other Reports, use the menu on the left side of the screen. To view a Report, simply click on its name.
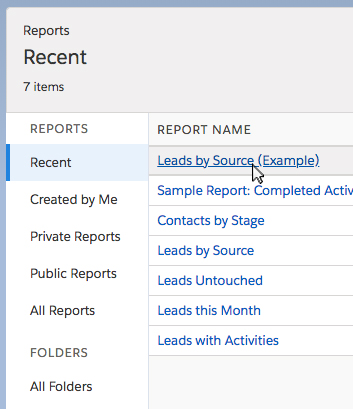
Table of Contents
Creating Reports
Put simply, a Report is a list of records; often times organized by specific fields. Reports can also display relationships to other objects. The best way to showcase the power of Reports is to create one yourself.
- To create a new Report, click the New Report button.

Don't see the button? Click the Reports tab on the homepage. You should see the button in the top right.
Once you've clicked New Report, you will be presented with a window asking you to choose a report type. The type of report you chose is dependent on what you would like to accomplish. For the purposes of this article, we are going to build a report that displays Leads for your account, organized by Lead Source.
Note: Newer versions of Propertybase contain this report by default. Rather than build a duplicate report, simply follow along with us as we walk-through the build process.
- For Report Type, select Contacts.
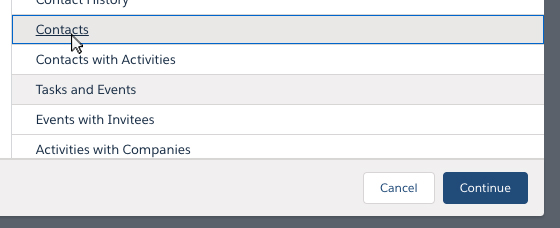
Note: Chosing a Report Type is important. Report Types determine what fields and records are available when creating and editing Reports. Click here to learn more about Report Types.
- Click Continue.
On the following screen, you may or may not see results. The first step in building a report is to edit filters until you are happy with the results displayed. Let's do that now.
- Click the Filters tab towards the top left of the screen.

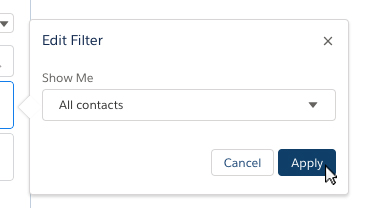
- In the list of Filters, click "My contacts" underneath Show Me.

If you would like to display Contacts for your entire Propertybase account, update this filter to "All contacts". If you would like to only display your individual Contacts, set the Filter to "My contacts".
- Once you've made your selection, click Apply.
- Next, click the Birthdate filter, update the Date field to Created Date and update the Range field to All Time. Once finished, click Apply.
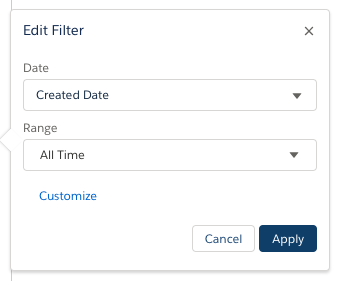
You should now see Results displayed on the right side of the screen. This is because our filter data is now displaying all contact records in your account, regardless of creation date.
Note: Only a limited number of records are displayed when creating or editing a Report. Once you save and run the report, all records will be displayed.
Next, let's group our Contact records by Lead Source. To do this we need to leave the Filter menu and open the Outline menu.
- Click Outline towards the top left of the screen (next to Filters.)

- Click "Add group..." and select Lead Source from the list of fields.

Our Report is now showing all contact records, grouped by lead source! We could stop here, but there are a few more options to consider prior to saving our new report.
At the bottom of the screen, you will see "Detailed Rows", "Subtotals" and "Grand Total" options. Toggling these options will demonstrate their effect on your report.
- Toggle the options below based on your personal preferences.

Finally, let's add a few additional fields that will be helpful when viewing our report. You should still be on the Outline menu. Locate the area of the screen that says "Columns".
- Click "Add column..." and click the Email field.

- Repeat that process for Phone, Stage, Contact Type and Last Activity.
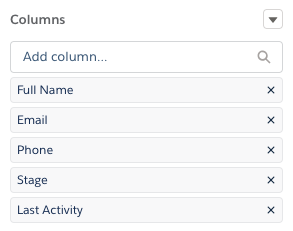
You should now see additional information for each Contact displayed in your Report. This increases the usability of our Report, negating the need to click each Contact individually to find this information. We are now ready to save our Report.
- Click the Save & Run button at the top of the screen.

- Next, name your report and select a folder to save to.
Note: For information regarding folders and sharing, see the "Folders & Sharing" section on this page.
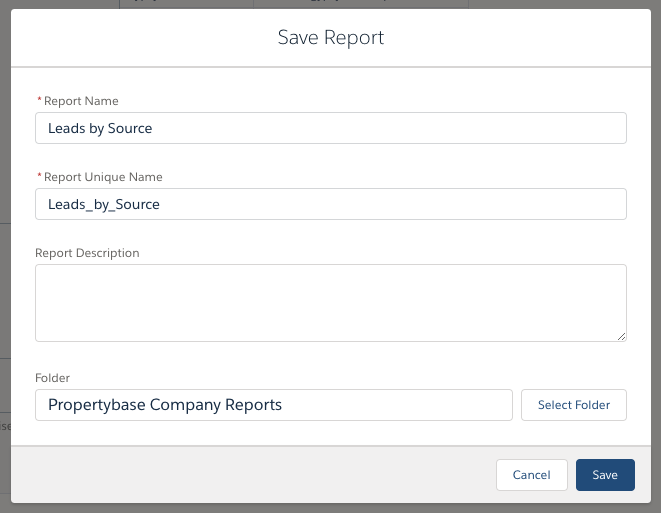
- When finished, click Save.
Folders & Sharing
Depending on the Report type and sensitivity of the information, they may be times when Reports should only be visible to specific Users. This can be accomplished through "folders". When you open the Reports overview page, you will see a menu for folders on the left side of the screen.
By default there are three folder types: All Folders, Created by Me and Shared with Me. Permissions for those folders are fairly self explanatory. You can also create new folders to share reports with specific groups within your organization.
- To create a new folder, click the New Folder button.

- Select a label and unique name for your folder, then click Save.
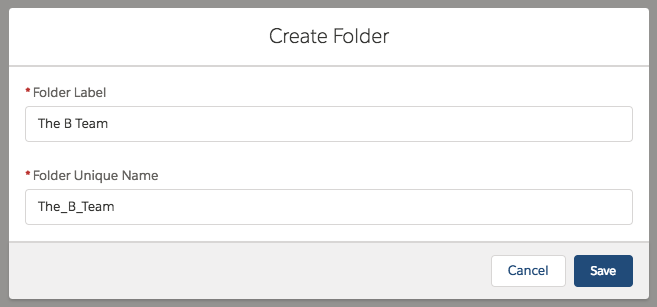
You just created a new folder. However, Propertybase will tell you that there are "No items to display." This will disappear as soon as a Report has been created in this Folder. Next, let's modify the sharing settings for this folder.
- Click All Folders on the left side of the screen.

- On the right side of the folder you just created, click the arrow and then click Share.
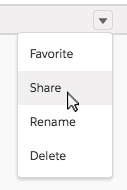
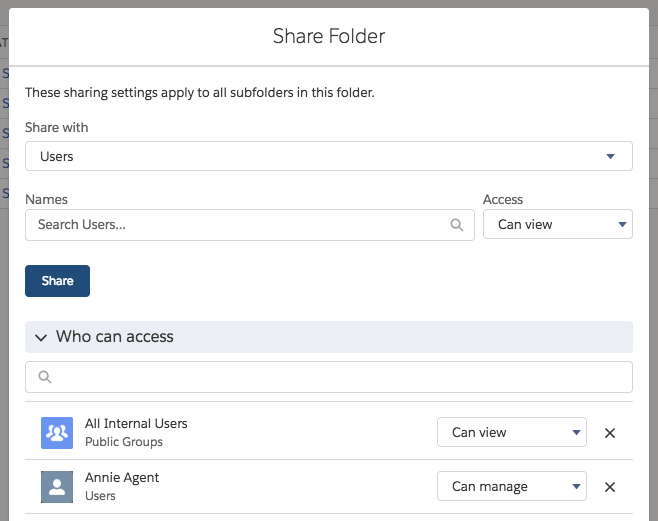
The following screen will provide several options to customize who can and cannot view the current folder.
Table of Contents
Viewing Reports
Once a Report is created, there are several features and options available when viewing it. If you are following along from the previous section, we just created a new Report (Leads by Source) and it should be displayed on your screen. If not, open any Report and follow along below.
Report Actions
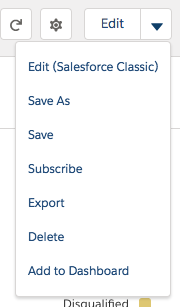
In the top right hand corner of the screen are a list of actions for the current Report.
Visualization
Does your new Report look a little plain? Visualizations in Propertybase allow you to visualize your Report data in a variety of different ways. Visualizing a Report makes it much easier to digest the information being displayed.
- To turn on visualization, click the chart icon in the top right menu.

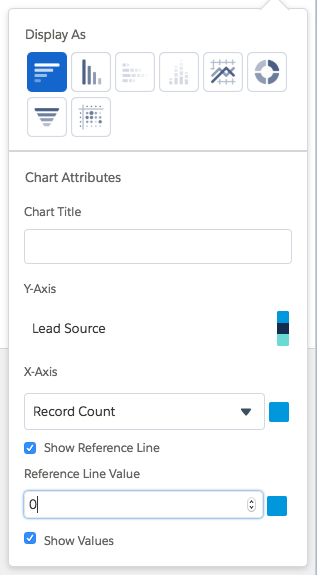
By default, a horizontal bar chart is displayed. This is already more useful than simply a list of names! However, there are many different visualization options available.
- To select a different option, click the gear icon next to the chart.

Filters
Filters are an integral piece of building or editing Reports. However, some situations call for different Filters than those specified when the Report was originally built. Using display Filters you can modify the results on the fly, for specific use cases!
- To modify display Filters, click the funnal icon in the top right menu.

This will open the Filter menu. Here you will see the original report filters. However, you can remove, add or modify existing filters on a case-by-case basis. Modifying Filters here, however, will not permanently impact your Report.
- After modifying Filter criteria, click Apply to see the changes.

Subscription
Want to receive a Report in your email inbox on a regularly basis? This is possible through the "Subscribe" feature! To subscribe to a Report, click the down arrow next to the Edit button and select Subscribe.
The following screen will allow you to select frequency, day of delivery and time.
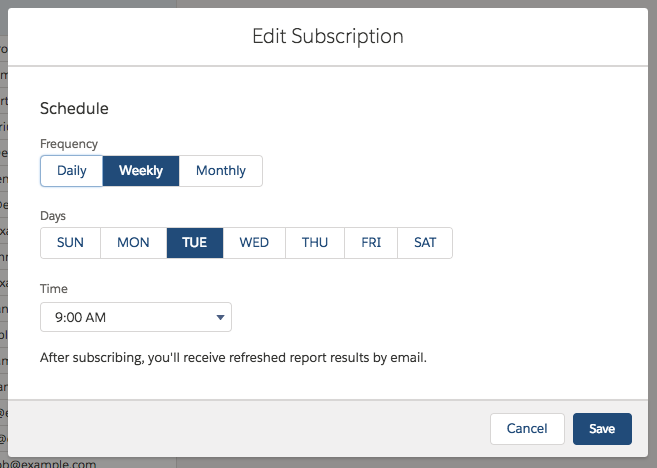
Once you've made your selection, click Save.
This is Part 9 of 10 in our Propertybase Core Features series. We recommend you continue to follow along, in order, as we walk through the entire Propertybase process, in detail, from lead to close.
Propertybase Core Features: Table of Contents
- Contact Management
- Create & Manage Companies
- Sending Email with Quicksend
- Inquiry Management
- Listing Management
- Property Management (Coming Soon)
- Offer Management (Coming Soon)
- Closing Management (Coming Soon)
- Using Reports
- Using Dashboards
Next Up: Using Dashboards
Now that you have mastered the art of reporting in Propertybase, it's time to put those Reports to use! In the next article we will discuss how to take multiple Reports and combine them to create powerful Dashboards.


Comments
0 comments
Article is closed for comments.