

Dashboard Components Follow

The new Dashboard Components will allow you as an agent to quickly access relevant information and act upon it. Among them are:
- Marketing Health
- Contact Database Health
- NEW: Activity Overview
- NEW: Last Attempted Contact
- NEW: Follow-up Calendar
These components are being rolled out in current and future releases.
- Configuration
- Marketing Health
- Contact Database Health
- NEW: Activity Overview
- NEW: Last Attempted Contact
- NEW: Follow-up Calendar
Configuration
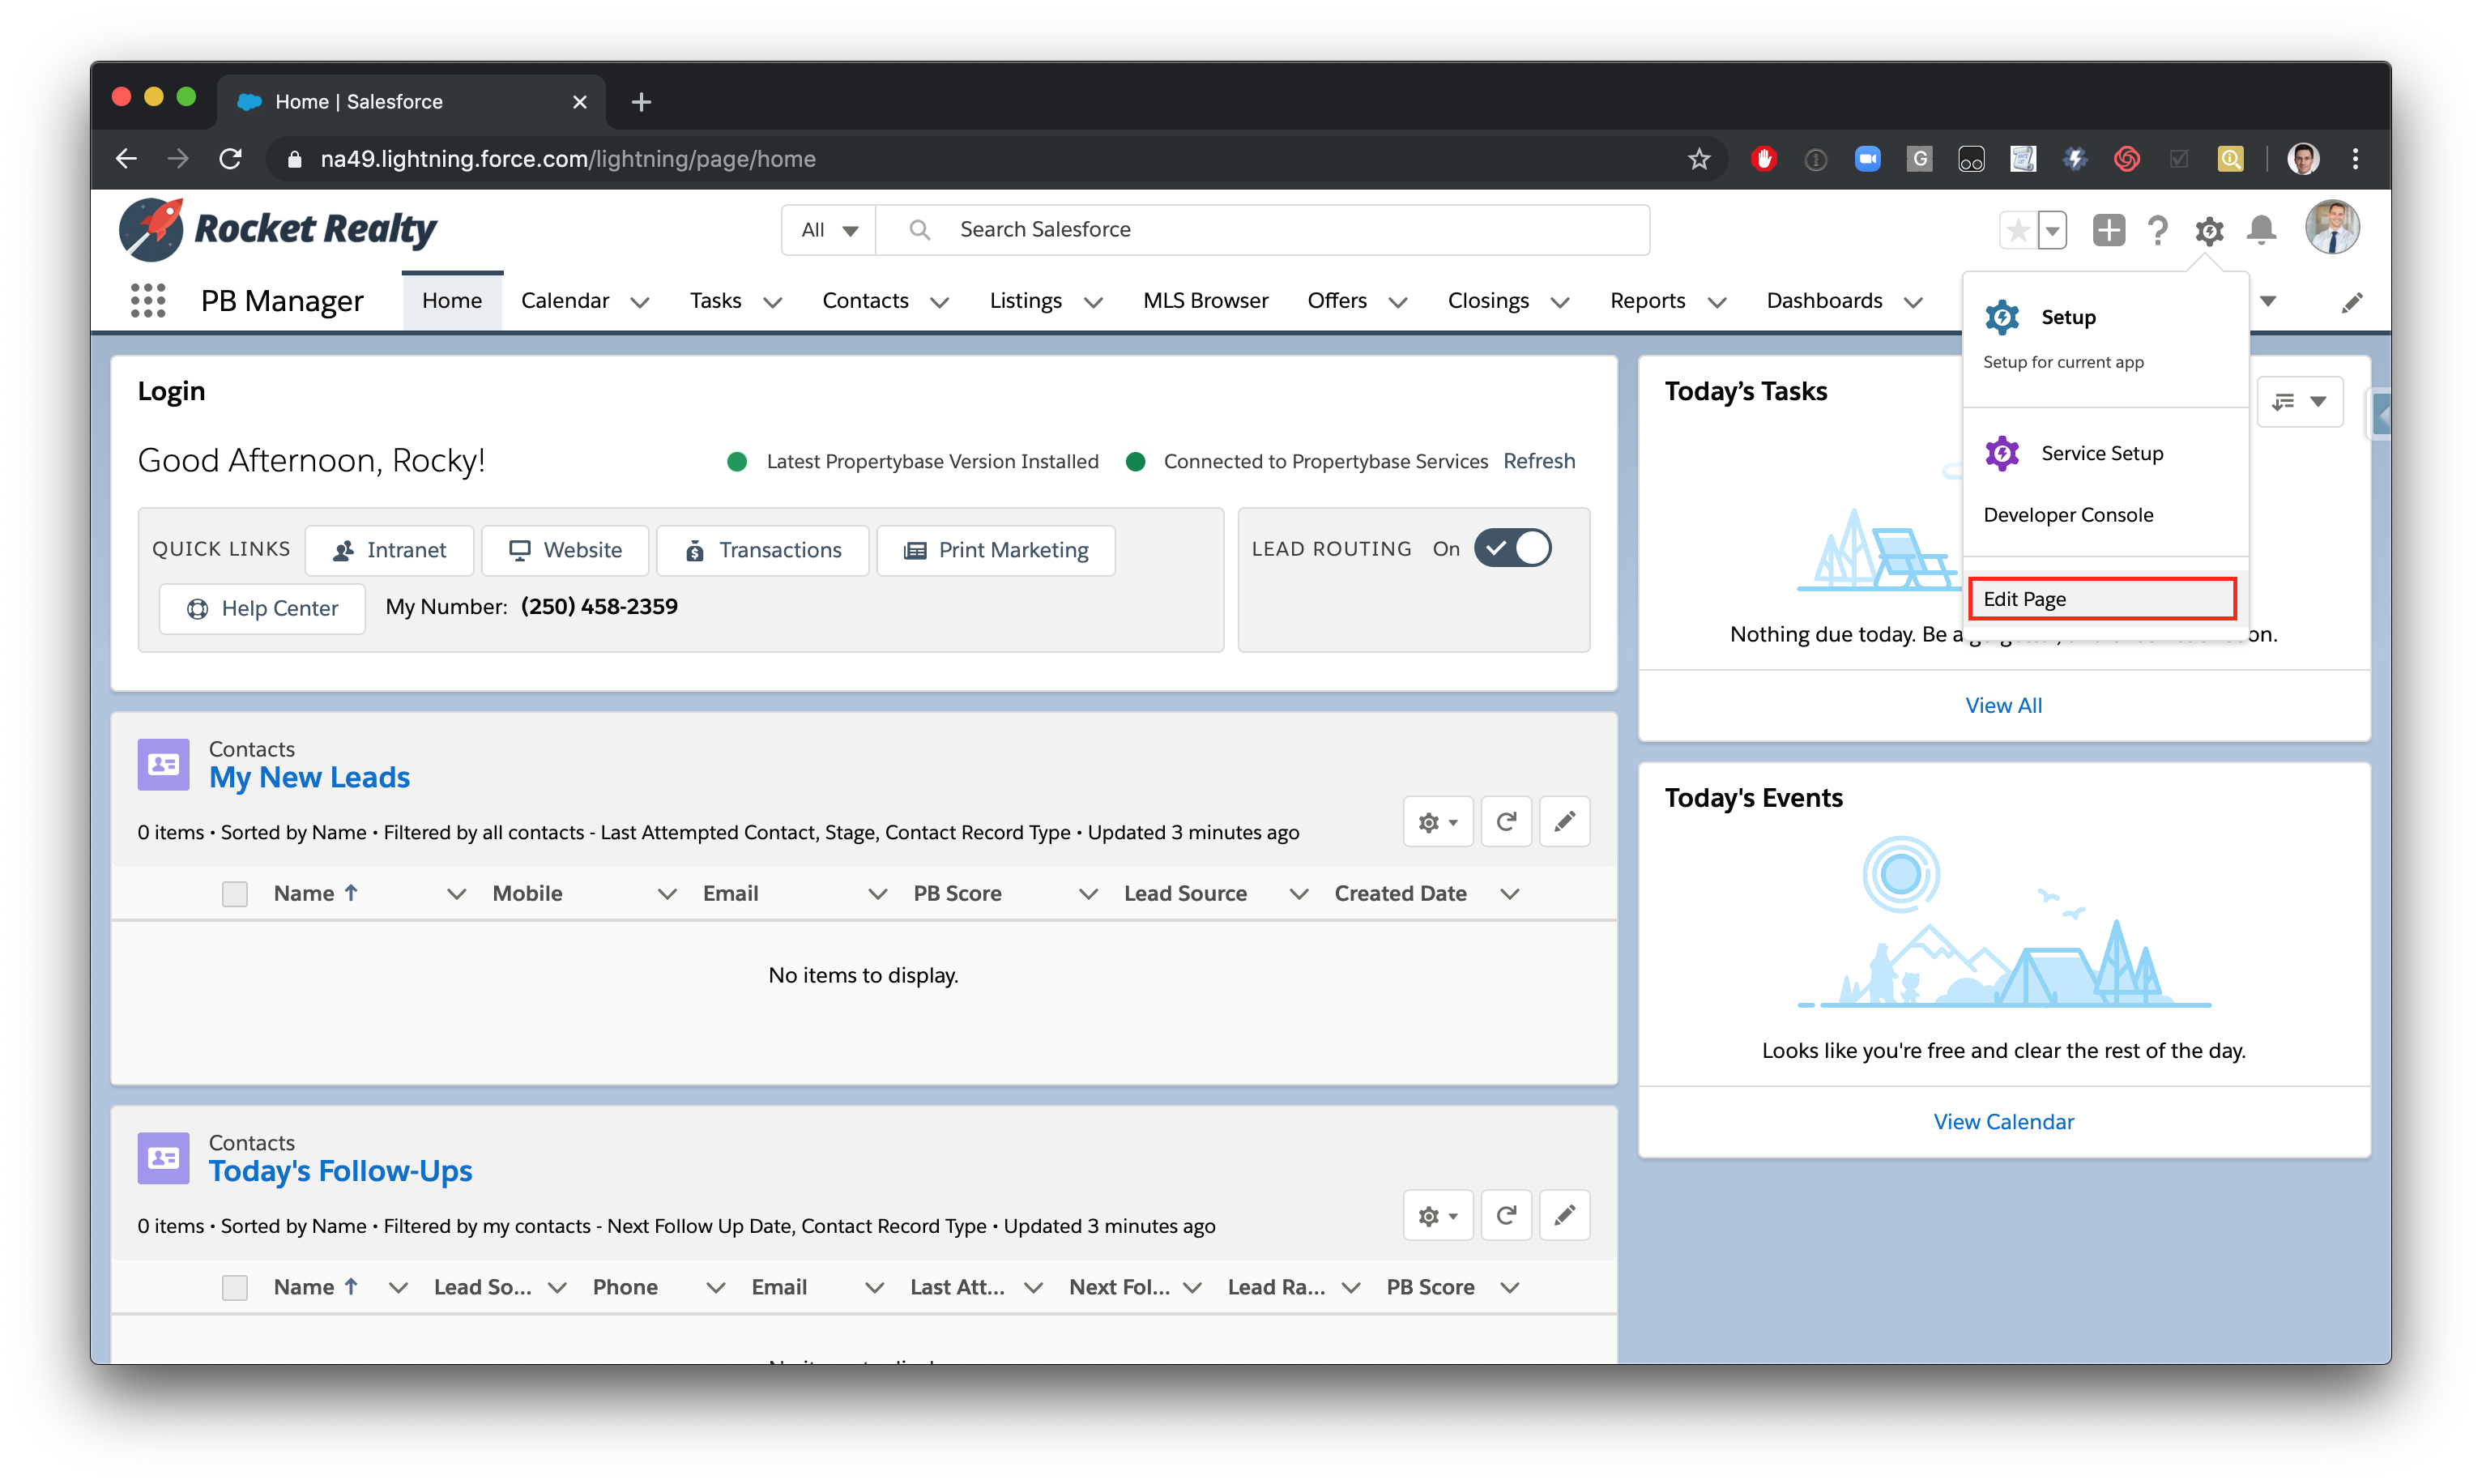
Go to "Edit Page" on your Home Page (or any other page)
Drag and drop the Managed Component you wish to add: "PB Marketing Health" or "PB Contact Database Health" onto the Page layout. For some components you will be able to add additional settings. For Marketing Health you can select up to 8 automations like Drip Campaigns or Action Plan Names; for Contact Database Health you can select up to 8 fields on the right to display in the respective charts. You can select up to 8 charts per component, per page you add them to. You can select more than one component per page.
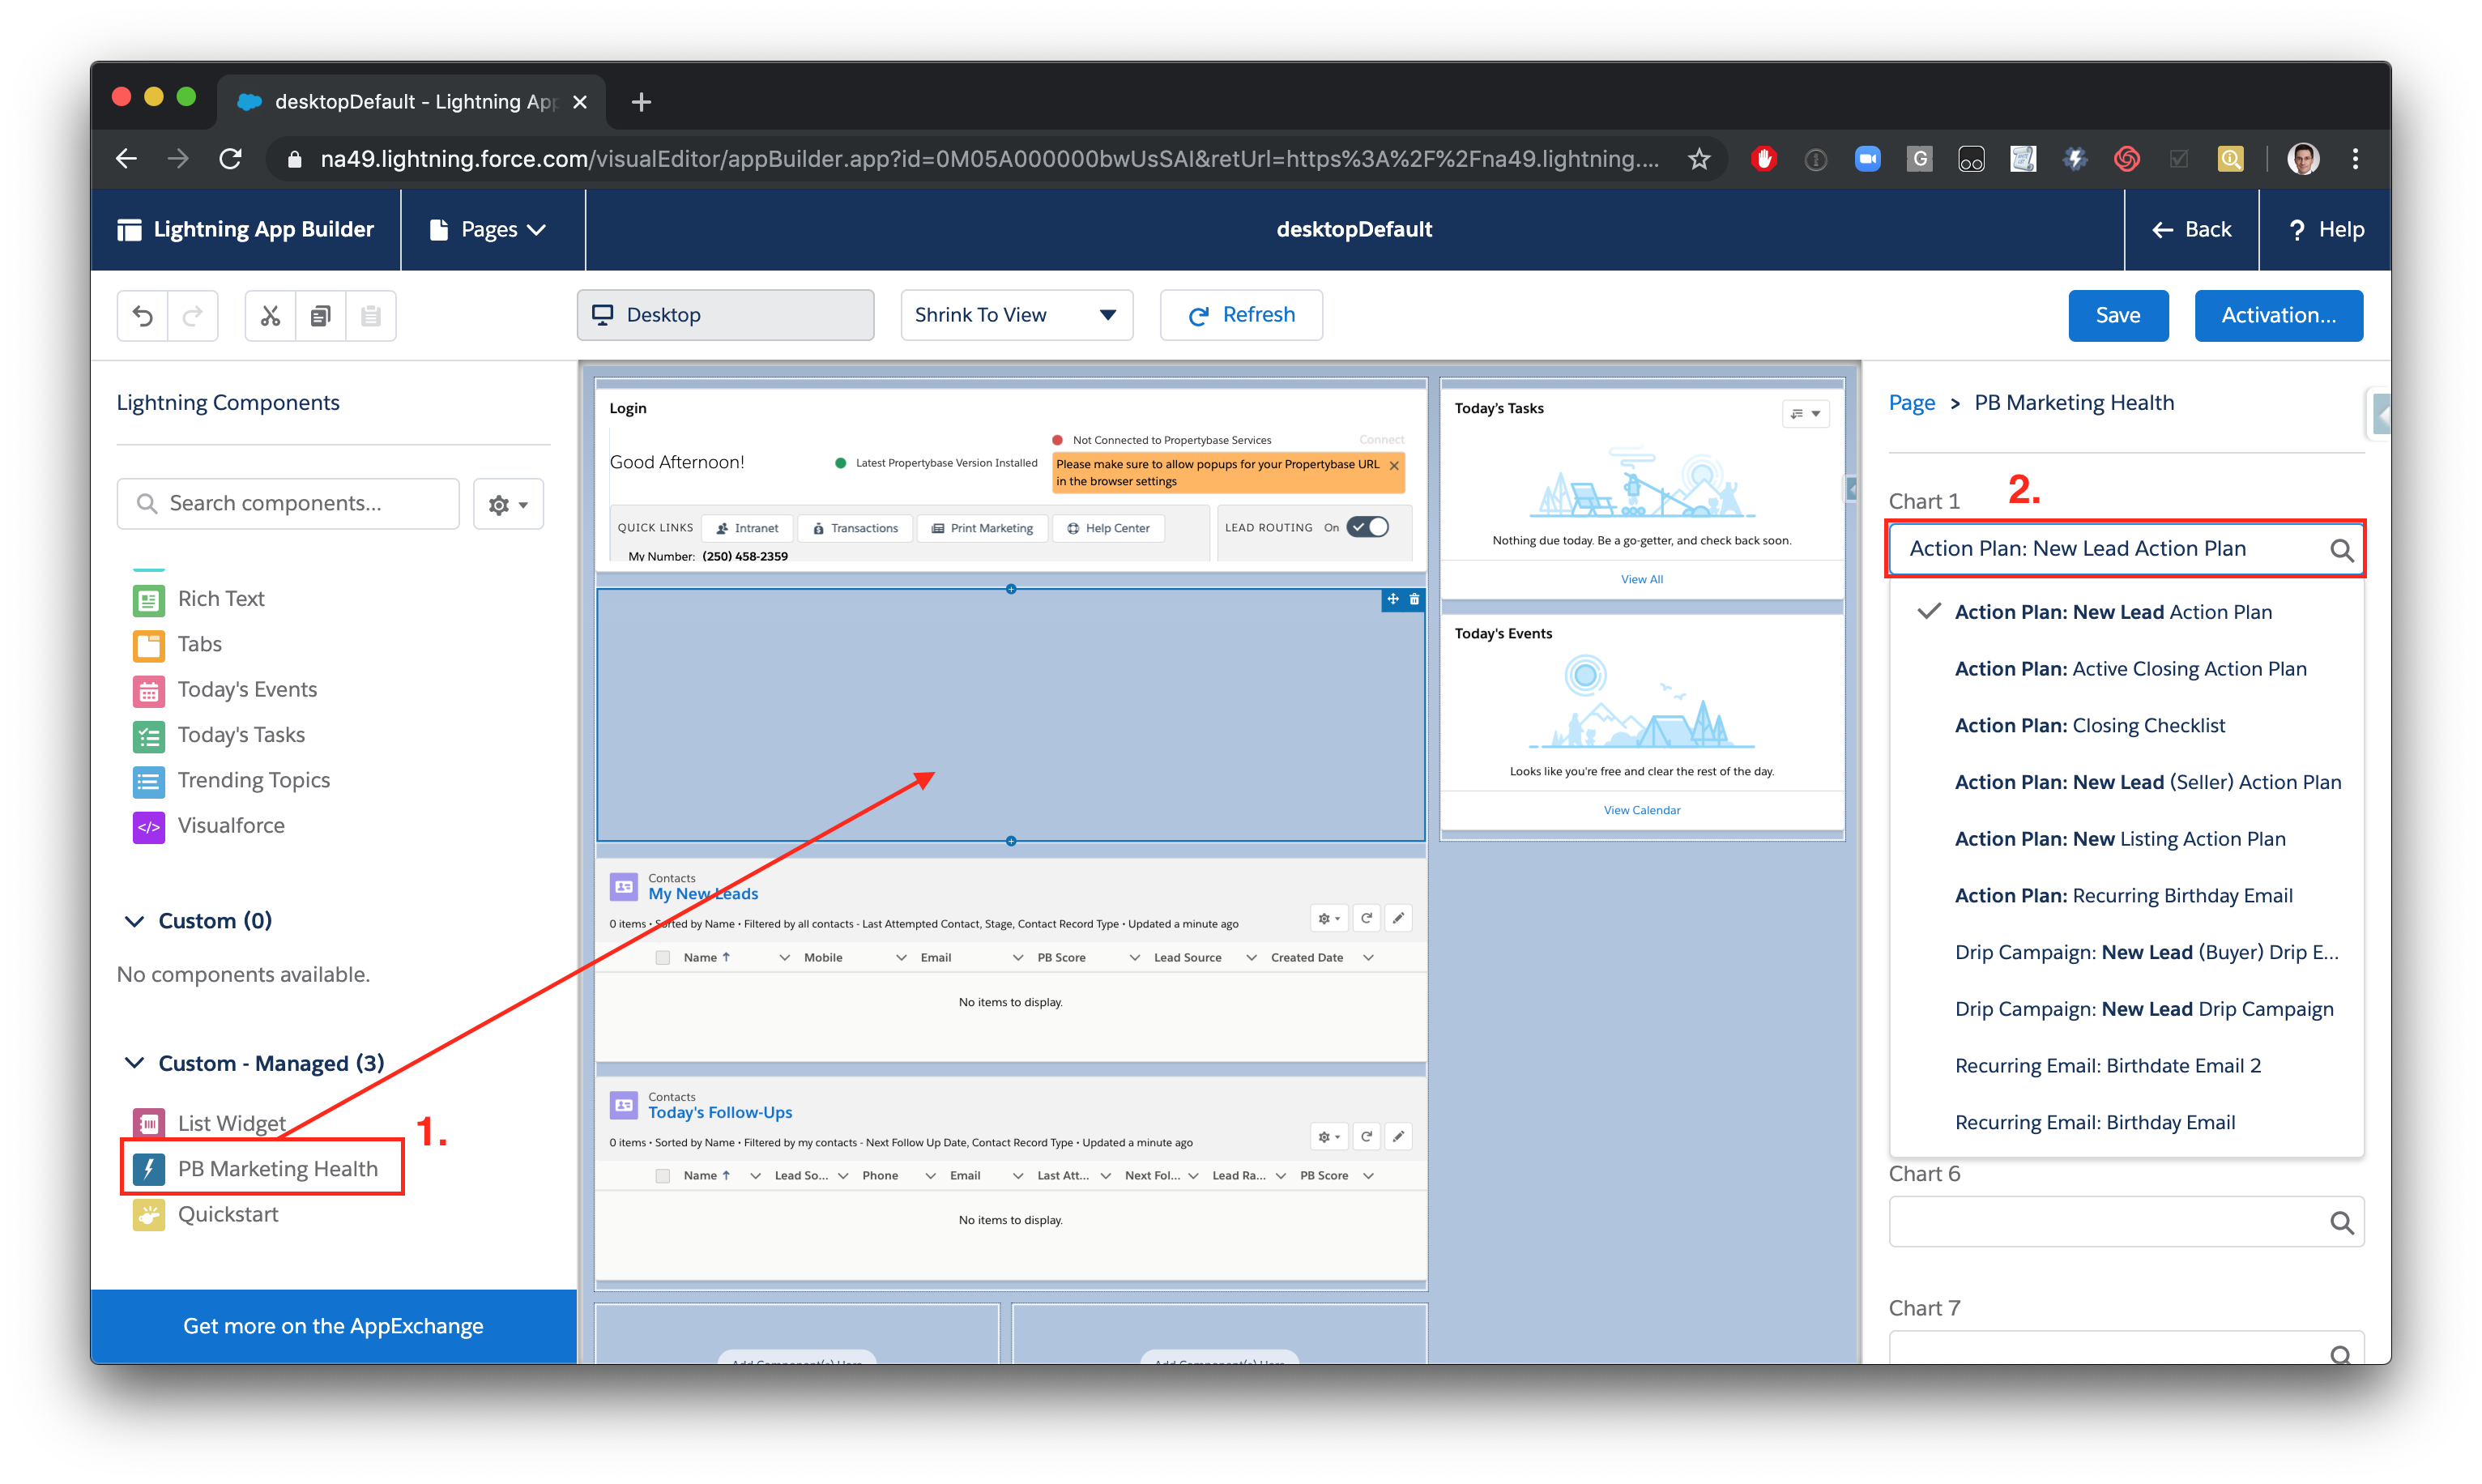
Click "Save" to save your progress, then go back to the home page to view the chart.
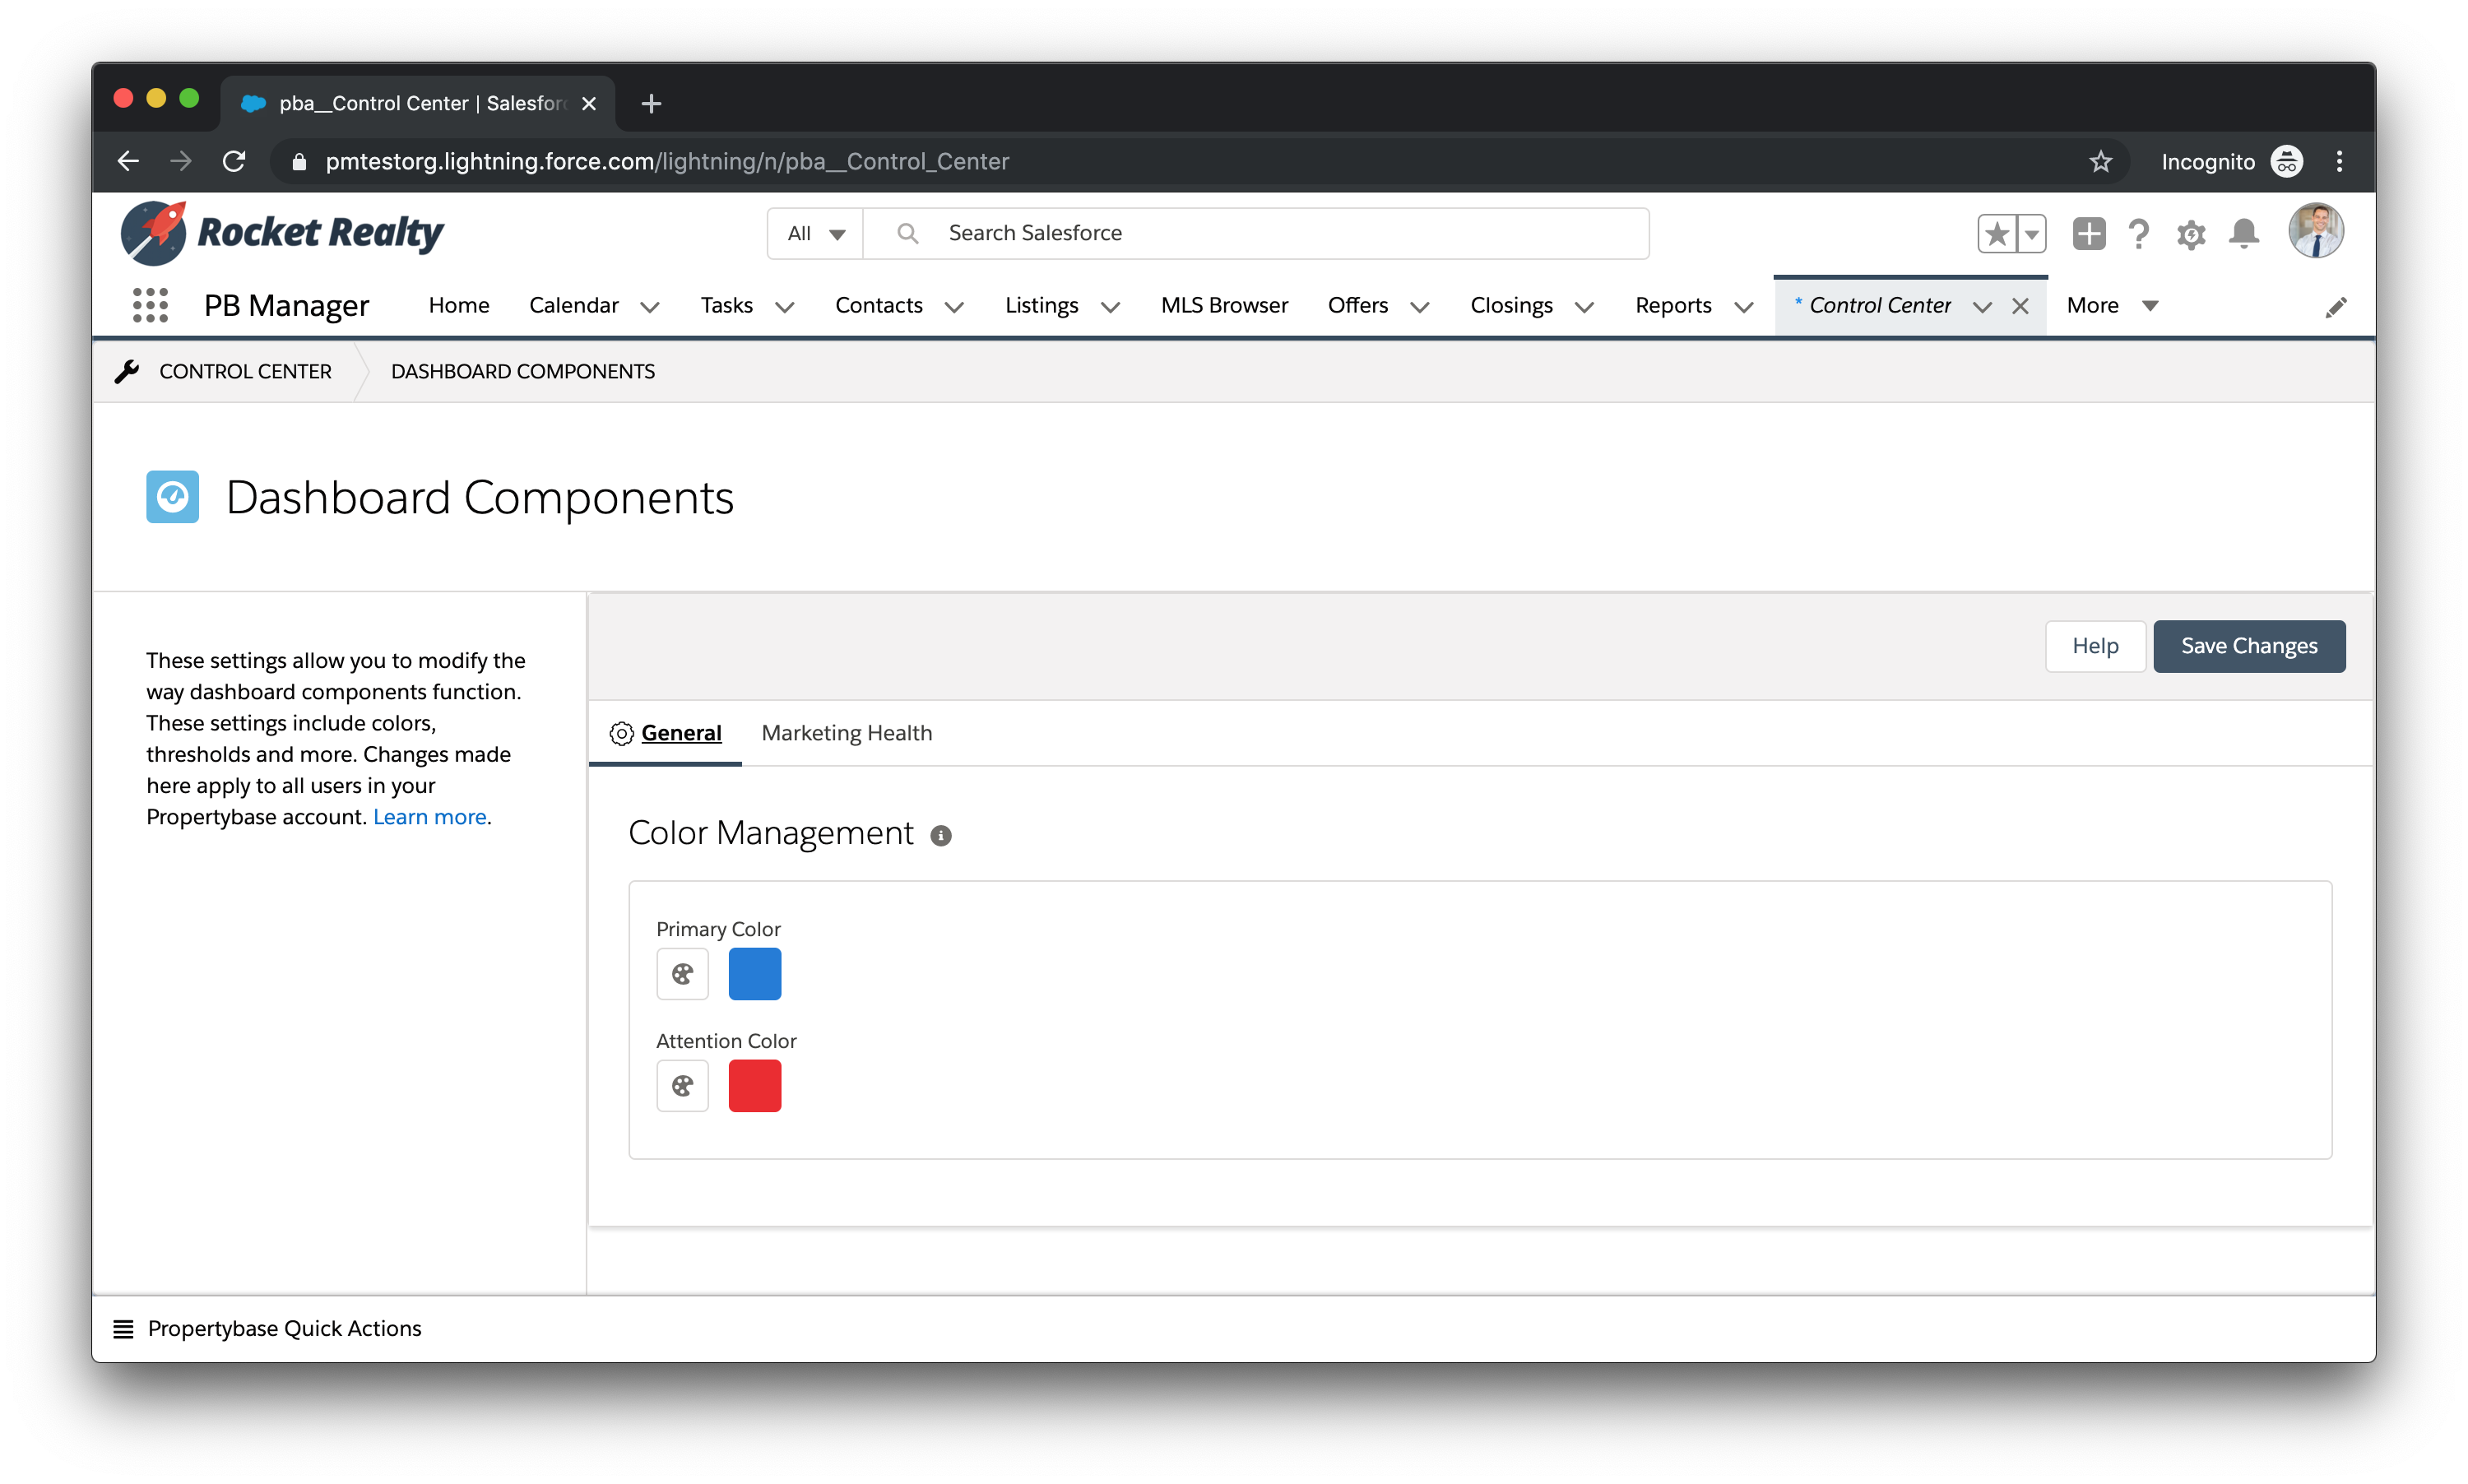
General settings
In the Control Center section "Dashboard Components" you can change the Primary and Attention colors of your components.
Changes made here apply to all users in your Propertybase account.
Make sure to click "Save Changes" for your changes to go into effect.
Please see the tabs specific to the dashboards for further instructions.
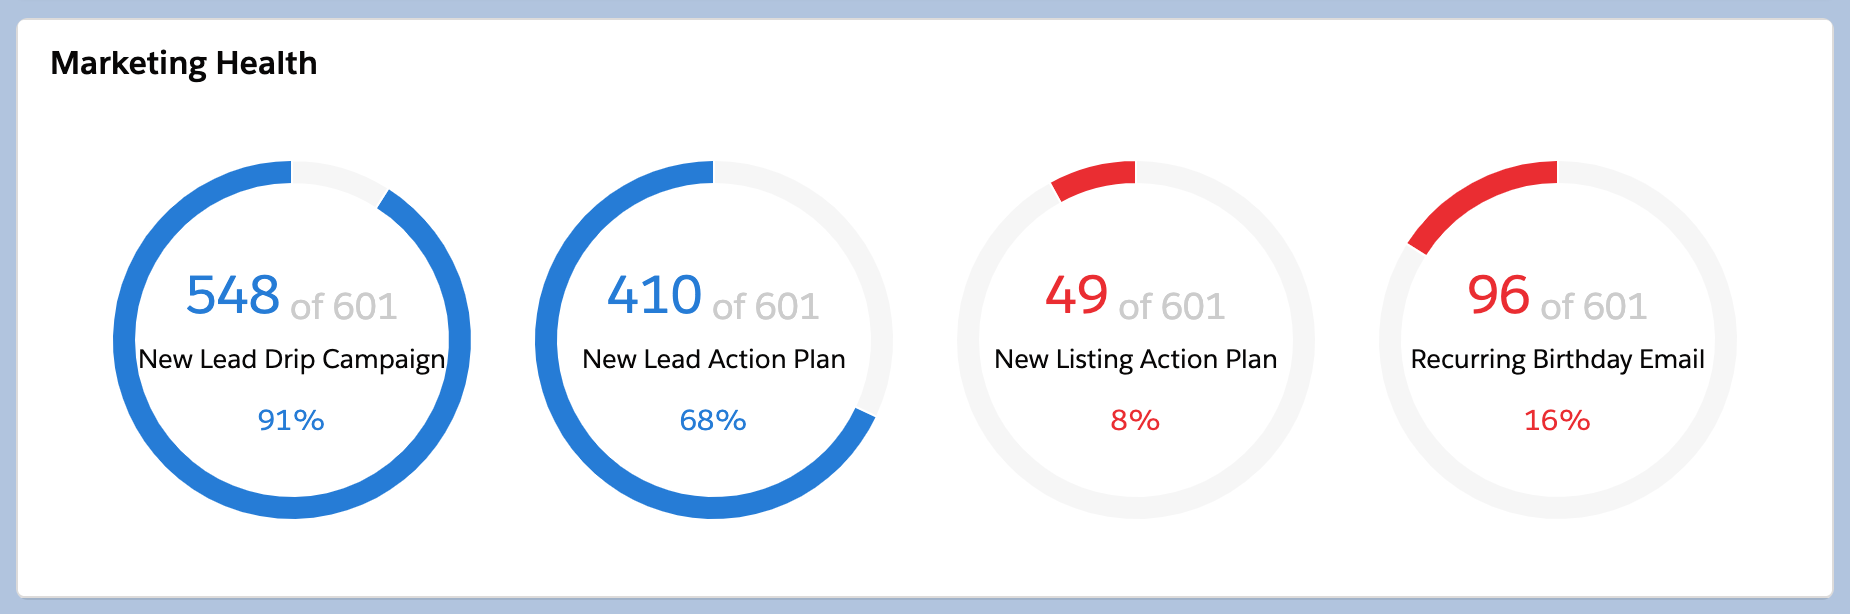
Marketing Health
Functionality
This component shows the percentage of your Contact Database on a given Marketing Automation in a component on your home page. When you click on a graph you can quickly add all other Contacts to these automations. The number in color shows all your own contacts that are on an automation (Drip Campaign, Action Plan, Recurring Email) with the respective name. Clicking on a graph takes you to a list of your contacts that are NOT on that automation.
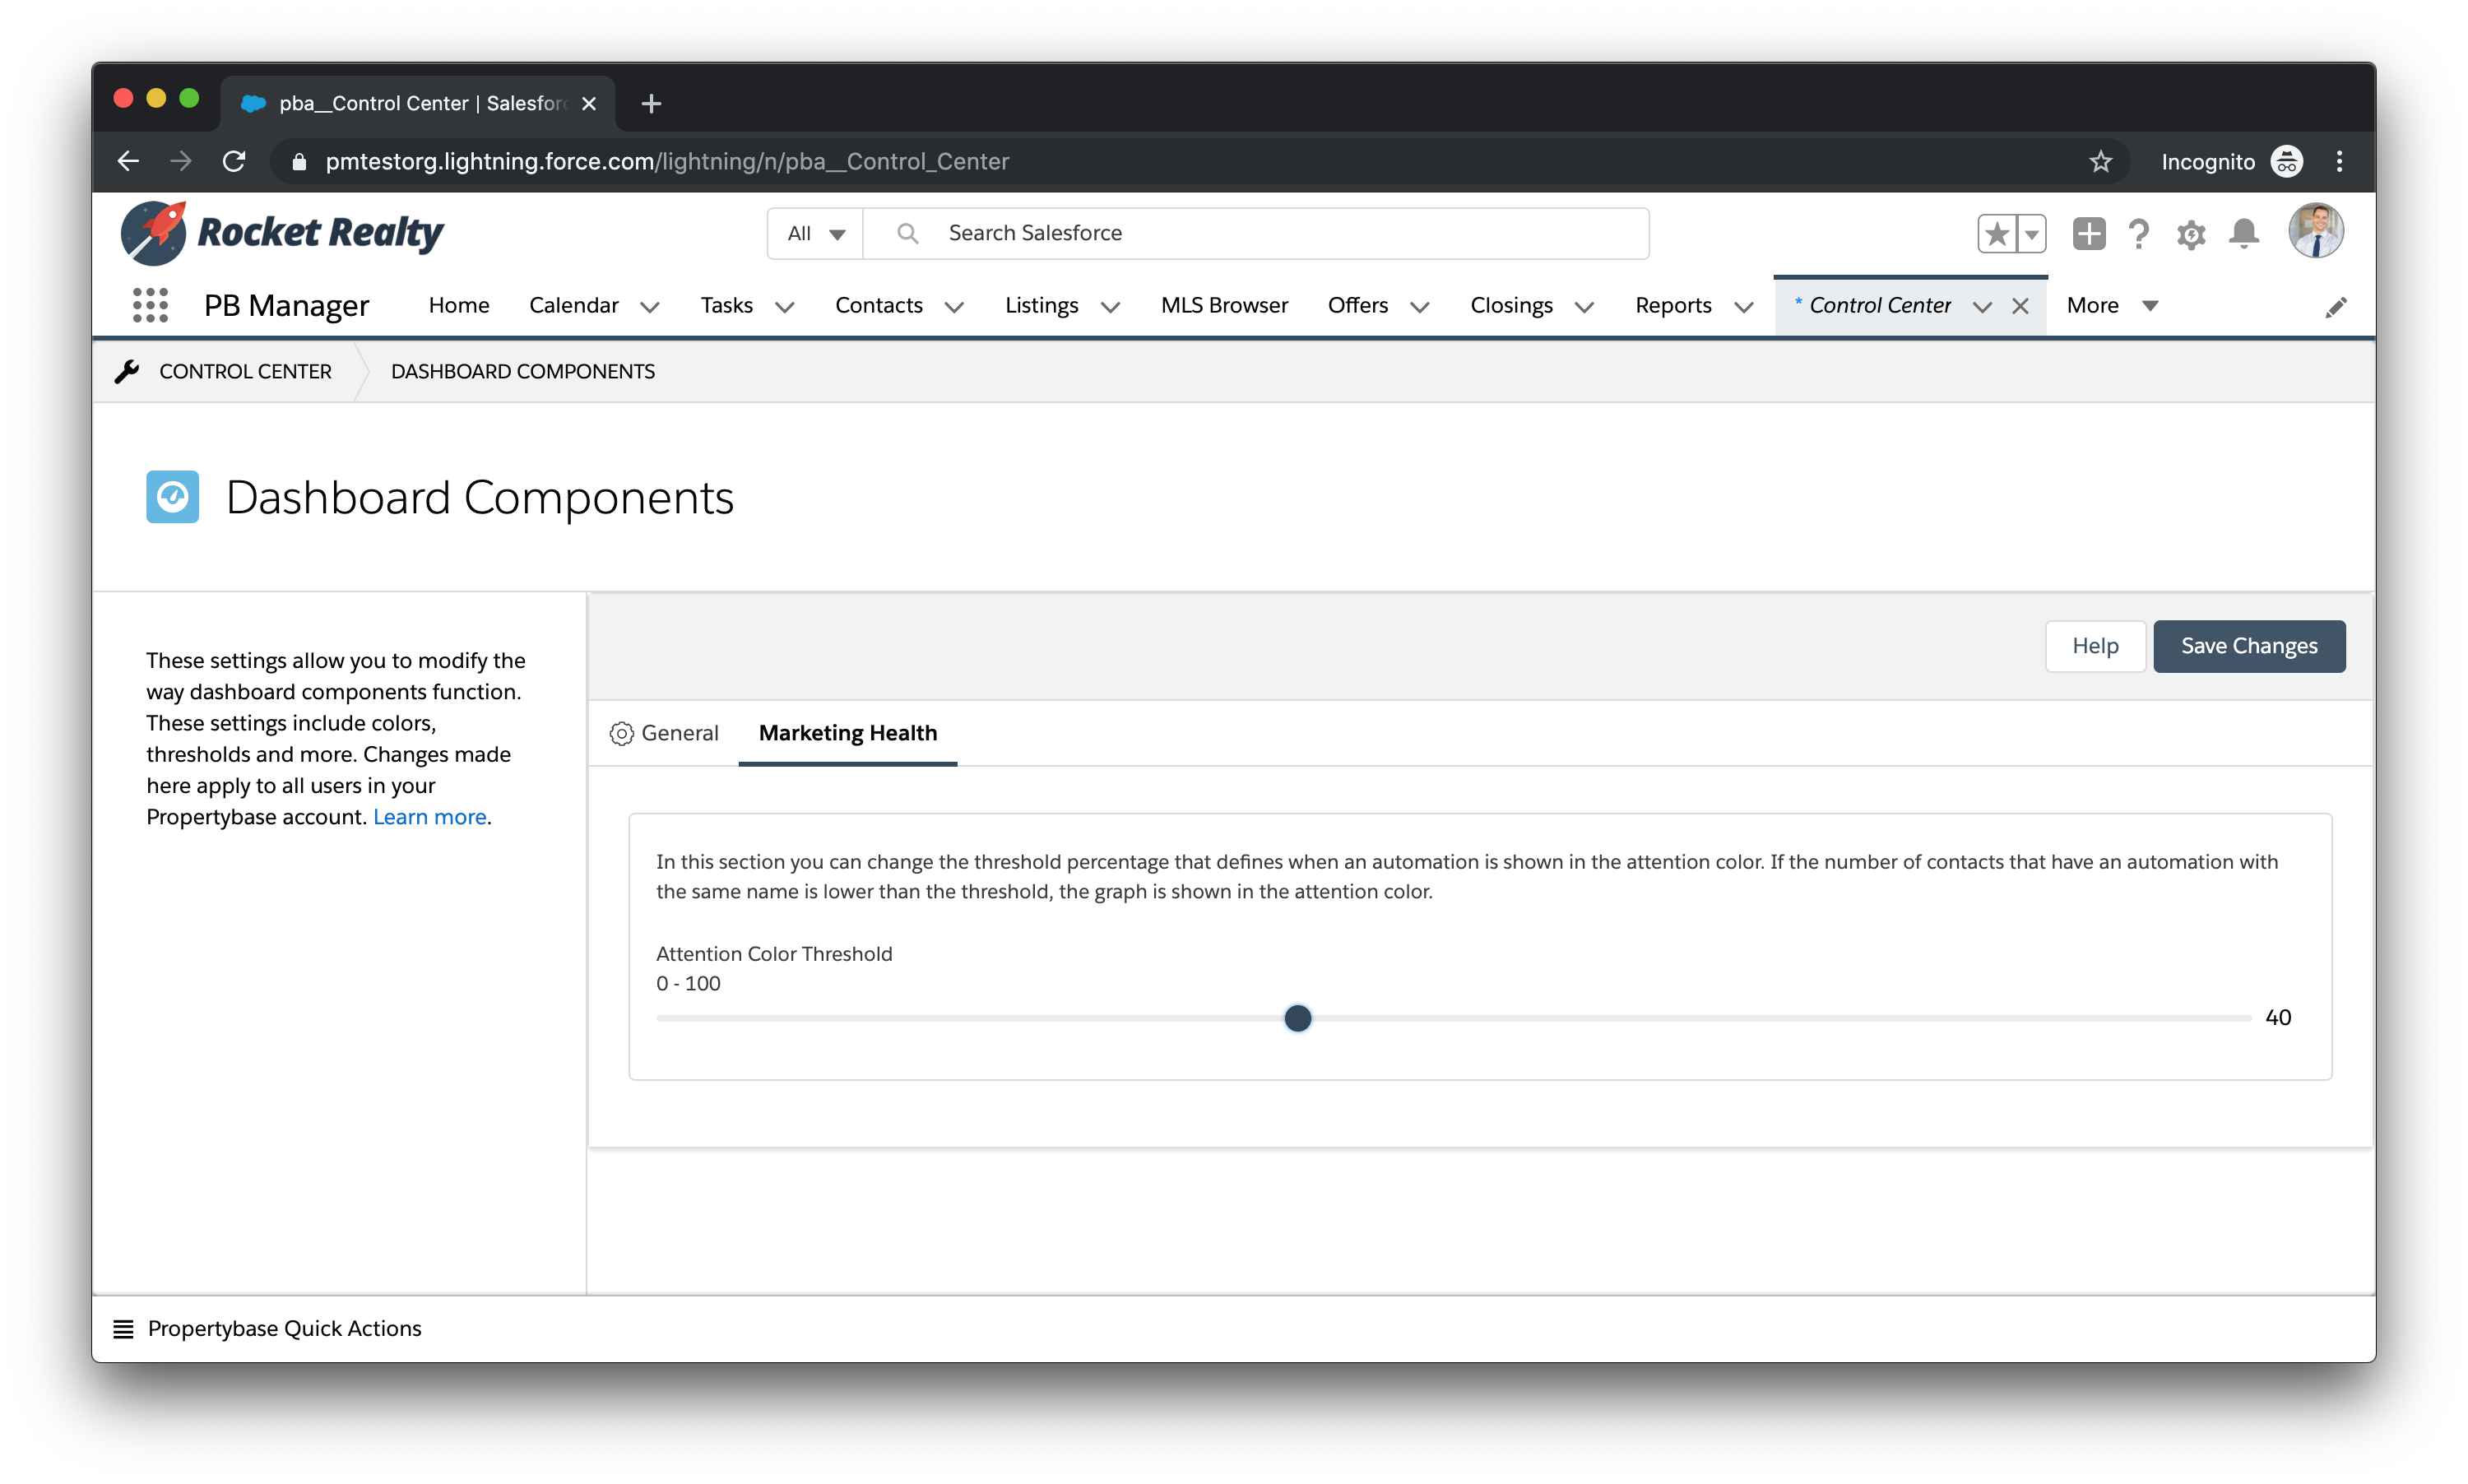
Adjust Threshold Percentage for Graphs
Go to the "Control Center" - "Dashboard Components" and there to the Tab "Marketing Health". In this section you can change the threshold percentage that defines when an automation is shown in the attention color. If the number of contacts that have an automation with the same name is lower than the threshold, the graph is shown in the attention color.
Contact List
When you click on a graph you get to a list of contacts that do NOT have this automation yet. You then have the option to put them on a Drip Campaign, send them an Email or add them to a static list.
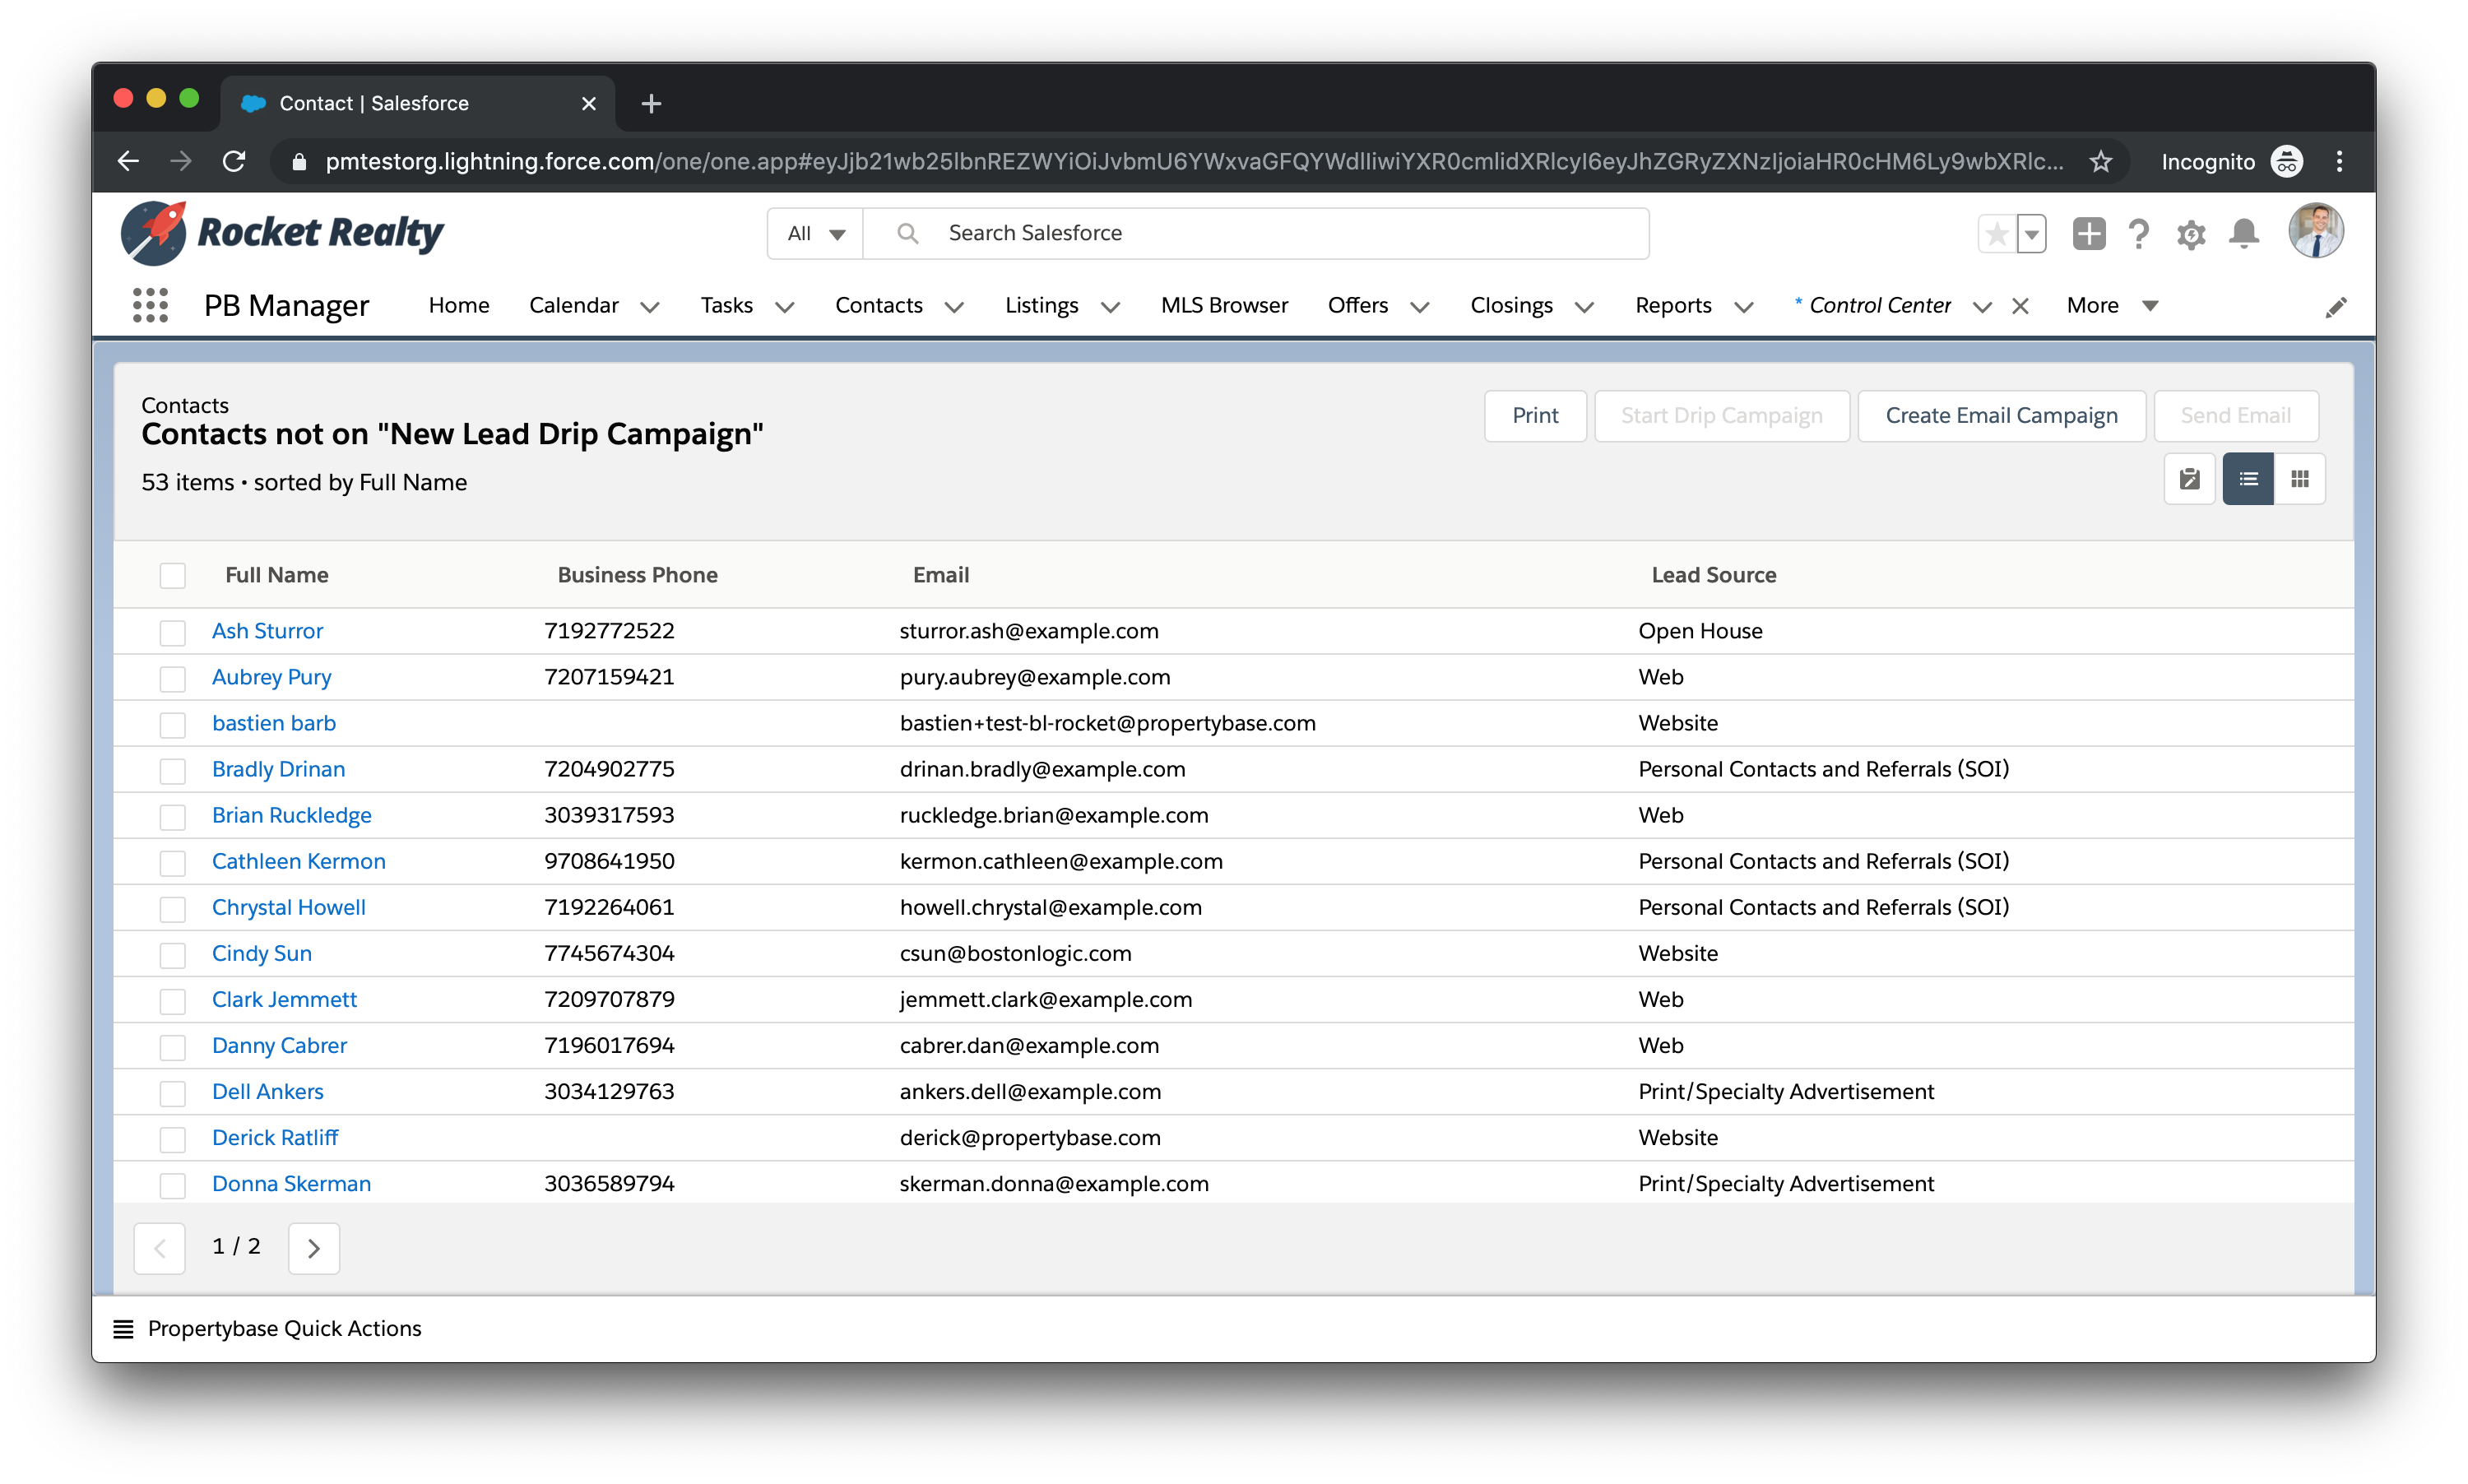
The columns and sorting of this list can be configured in the Control Center section "Record Managers". More information on record managers can be found here.
Contact Database Health
Functionality
This component shows the percentage of your Contact Database on a given Lead Stage in a component on your Home page and any other page you wish to add it to. You can add or change contact fields when you go to "Edit Page", select the component and have a look to the right side.
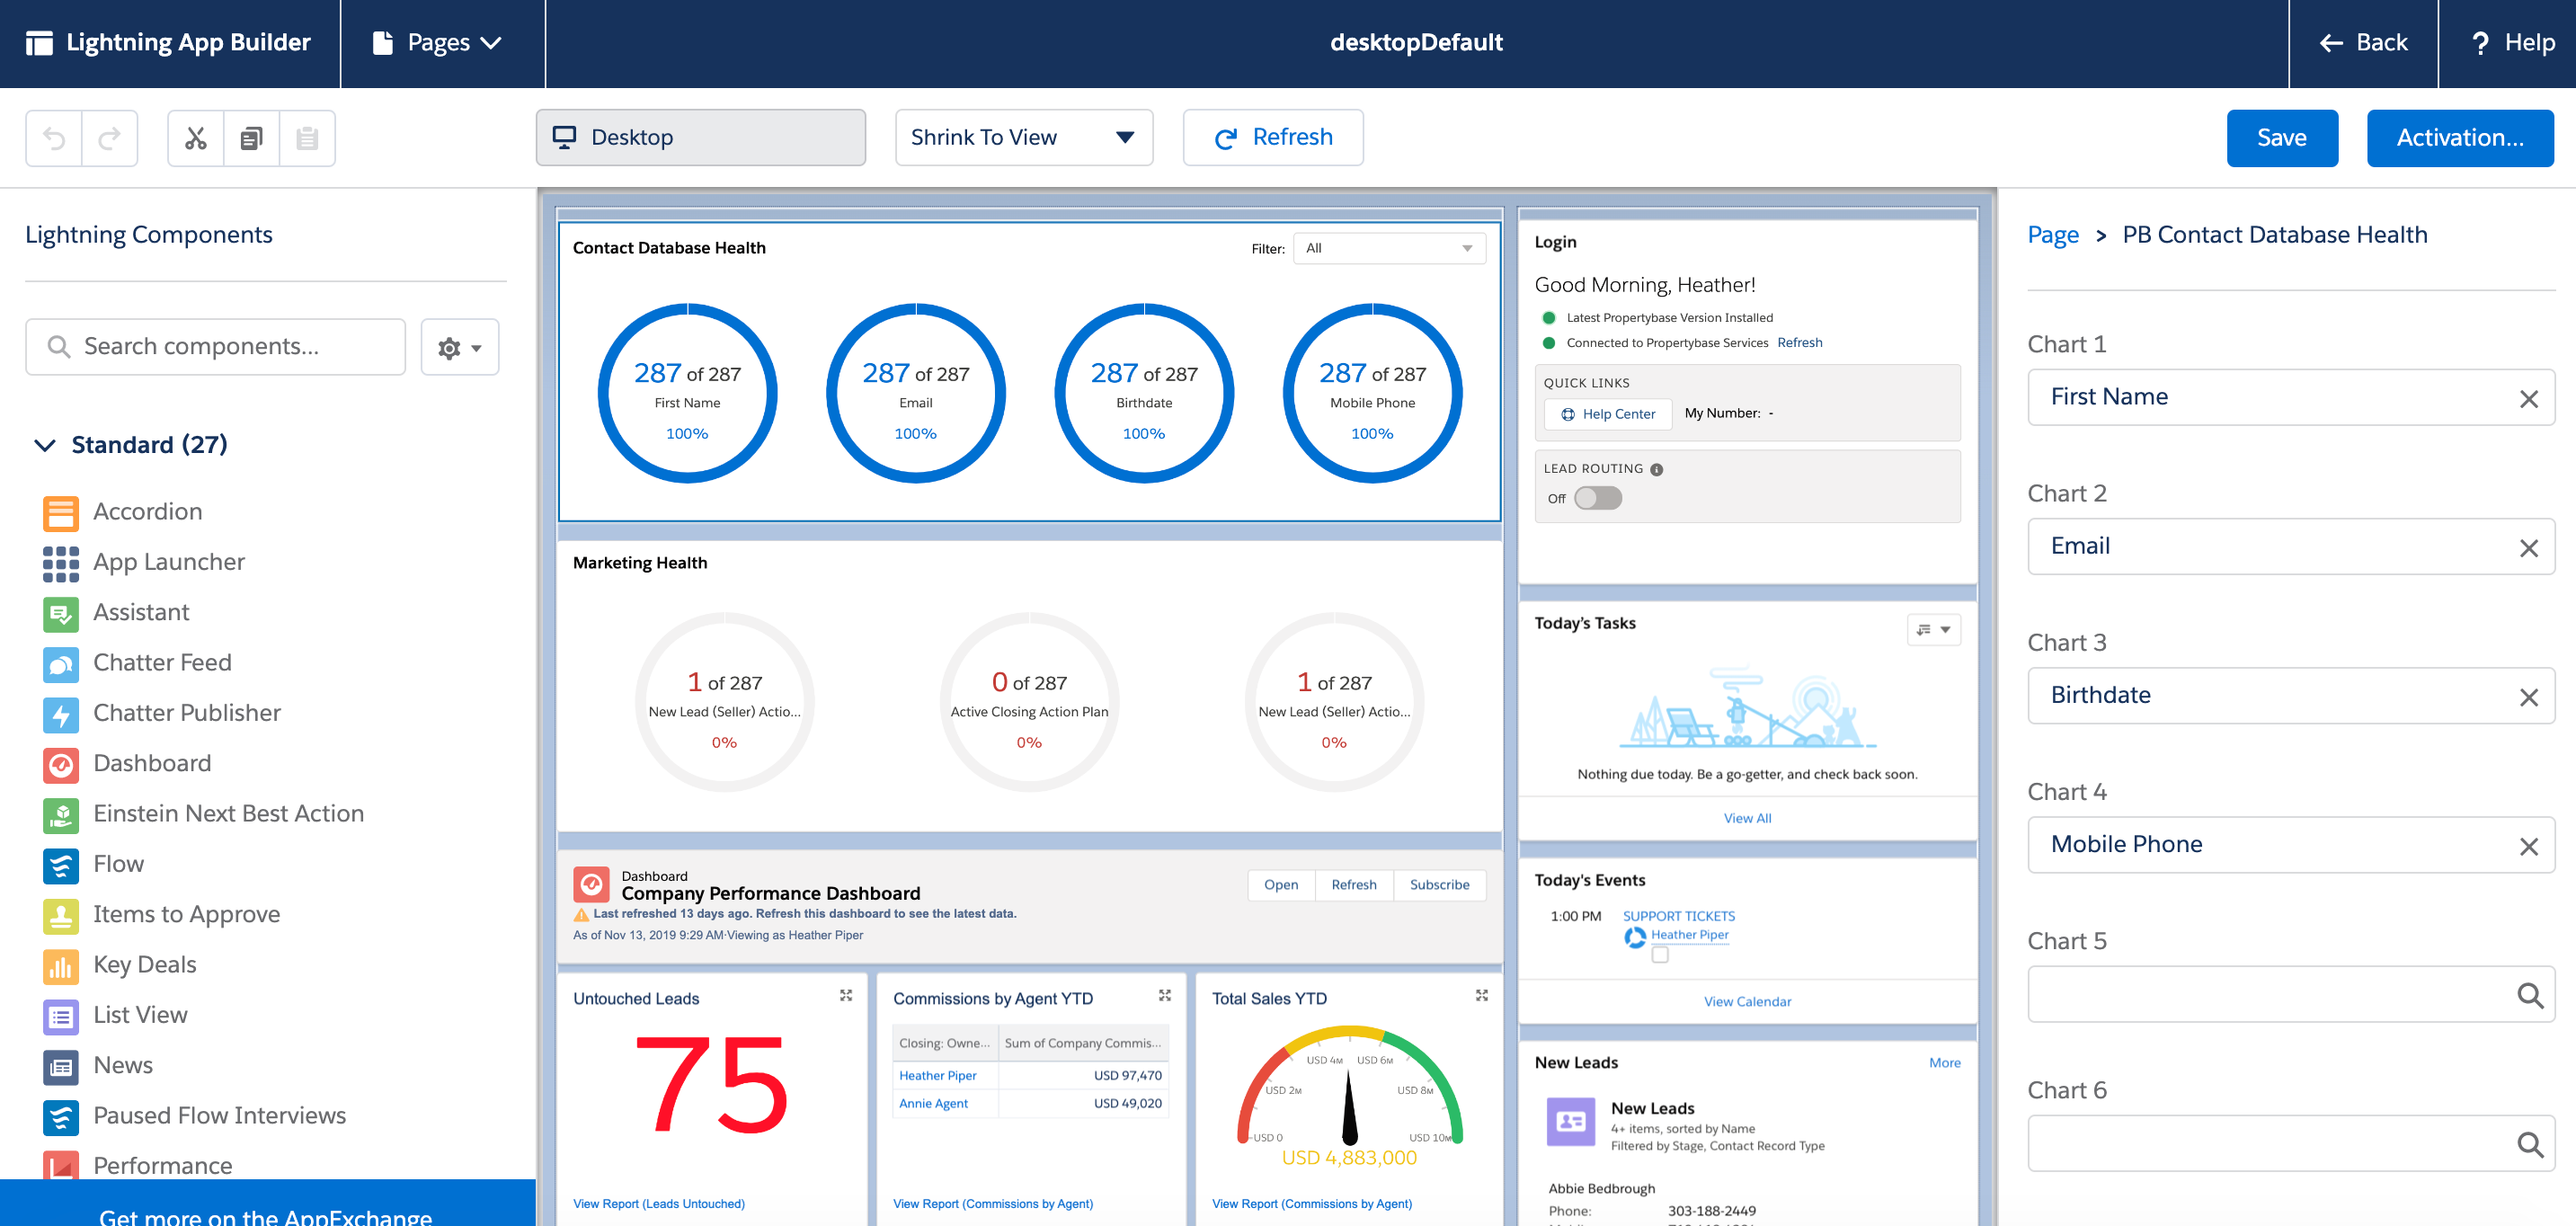
The number in color shows all of your own contacts where the selected field is filled. You can also filter to see only one specific Lead stage in the top right filter dropdown. This filter will show all lead stages (field: pba__Stage_pb__c) that are active picklist values.
Adjust Thresholds for Graphs
Go to the "Control Center" - "Dashboard Components" and there to the Tab "Contact Database Health". In this section, you can change the threshold percentage that defines when an automation is shown in the attention color. If the number of contacts that have the field filled is lower than the threshold, the graph is shown in the attention color.

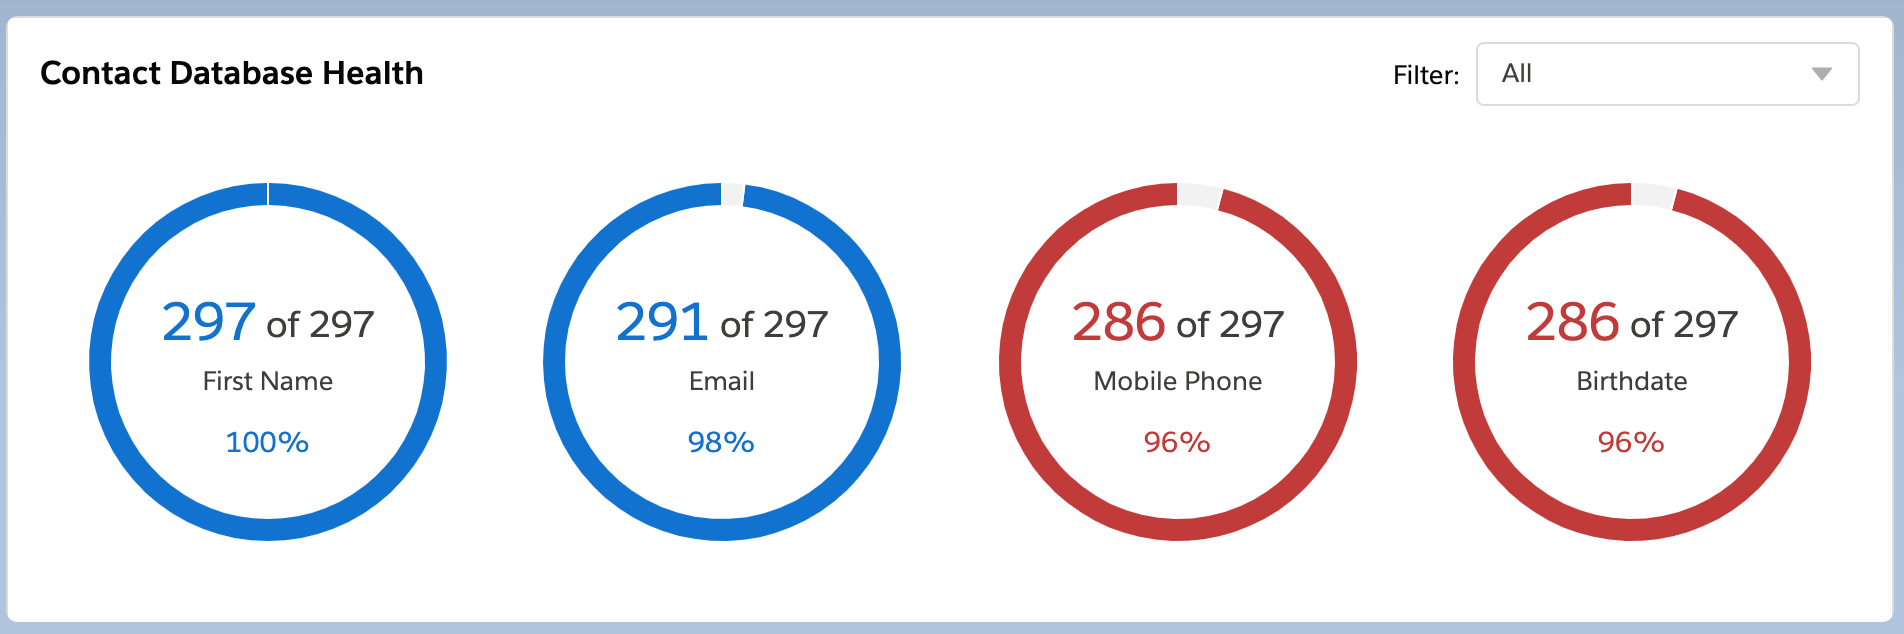
NEW: Add filter groups to display in your Propertybase Logo
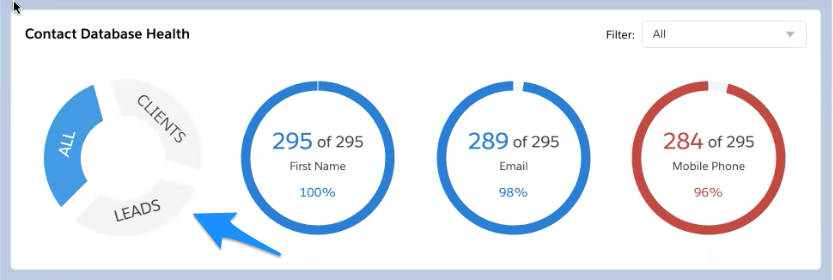
Currently, above "All" is selected, so you see the count of all values in each of the circles to the right.
If you select Leads or Clients above, the values to the right will update for those filters.
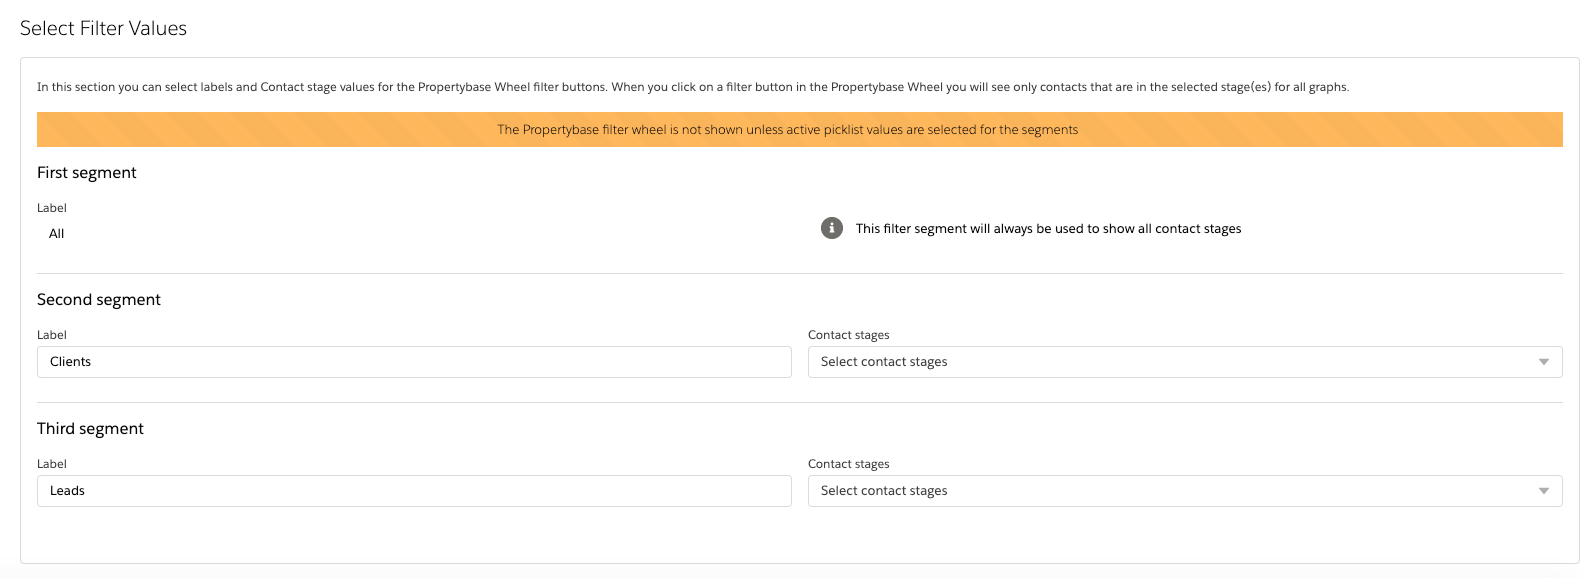
To configure this, follow the steps below:
- Go into the Control Center.
- Select Dashboard Components.
- Next, click on Contact Database Health Component.
- Now you can set up the filters you want to use for each coinciding circle. Make sure to select the Contact stages that you want to see for the respective segment.
Also, please note:

Click Save and you're all set!
New: Set Default Filter
If you'd like to change the default from All to one of the other filter options for this component, you can do that from the Home page.
First, select Edit Page from the setup icon:
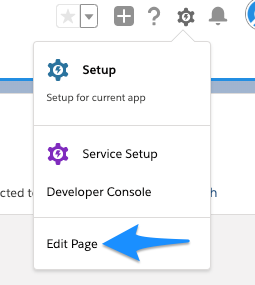
Once there, click on the Contact Database Health Component and you'll see the Default Filter. Here you can set the default filter value for all future use:
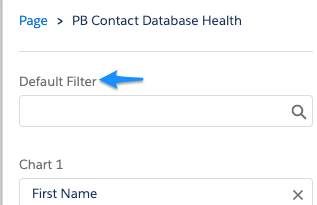
Once entered don't forget to Save!
Contact List
When you click on a graph you get to a list of contacts that do NOT have this automation yet. You then have the option to add them to the selected lists.
The columns and sorting of this list can be configured in the Control Center section "Record Managers". More information on record managers can be found here.
NEW: Activity Overview
New in version 1.640!
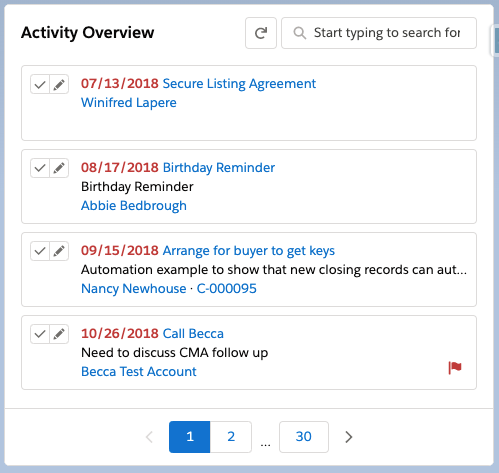
Functionality
This component shows the current and overdue Propertybase Tasks. The initial display contains the following information per task:
- Task Title
- Task Date
- Task subject or description
- The Whatid and/or Whoid that is tied to the task (related Contacts, Listings, Transactions etc.).
To show each Task has been completed you can select the checkmark to the left of the Task:

This will strikethrough the task to show it has been done.
To edit a Task, simply click the pencil next to the Task:
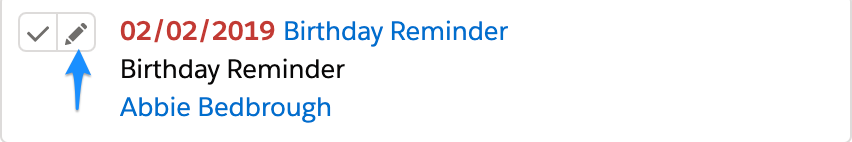
Once in edit mode, you'll see where you can change the details of the Task:

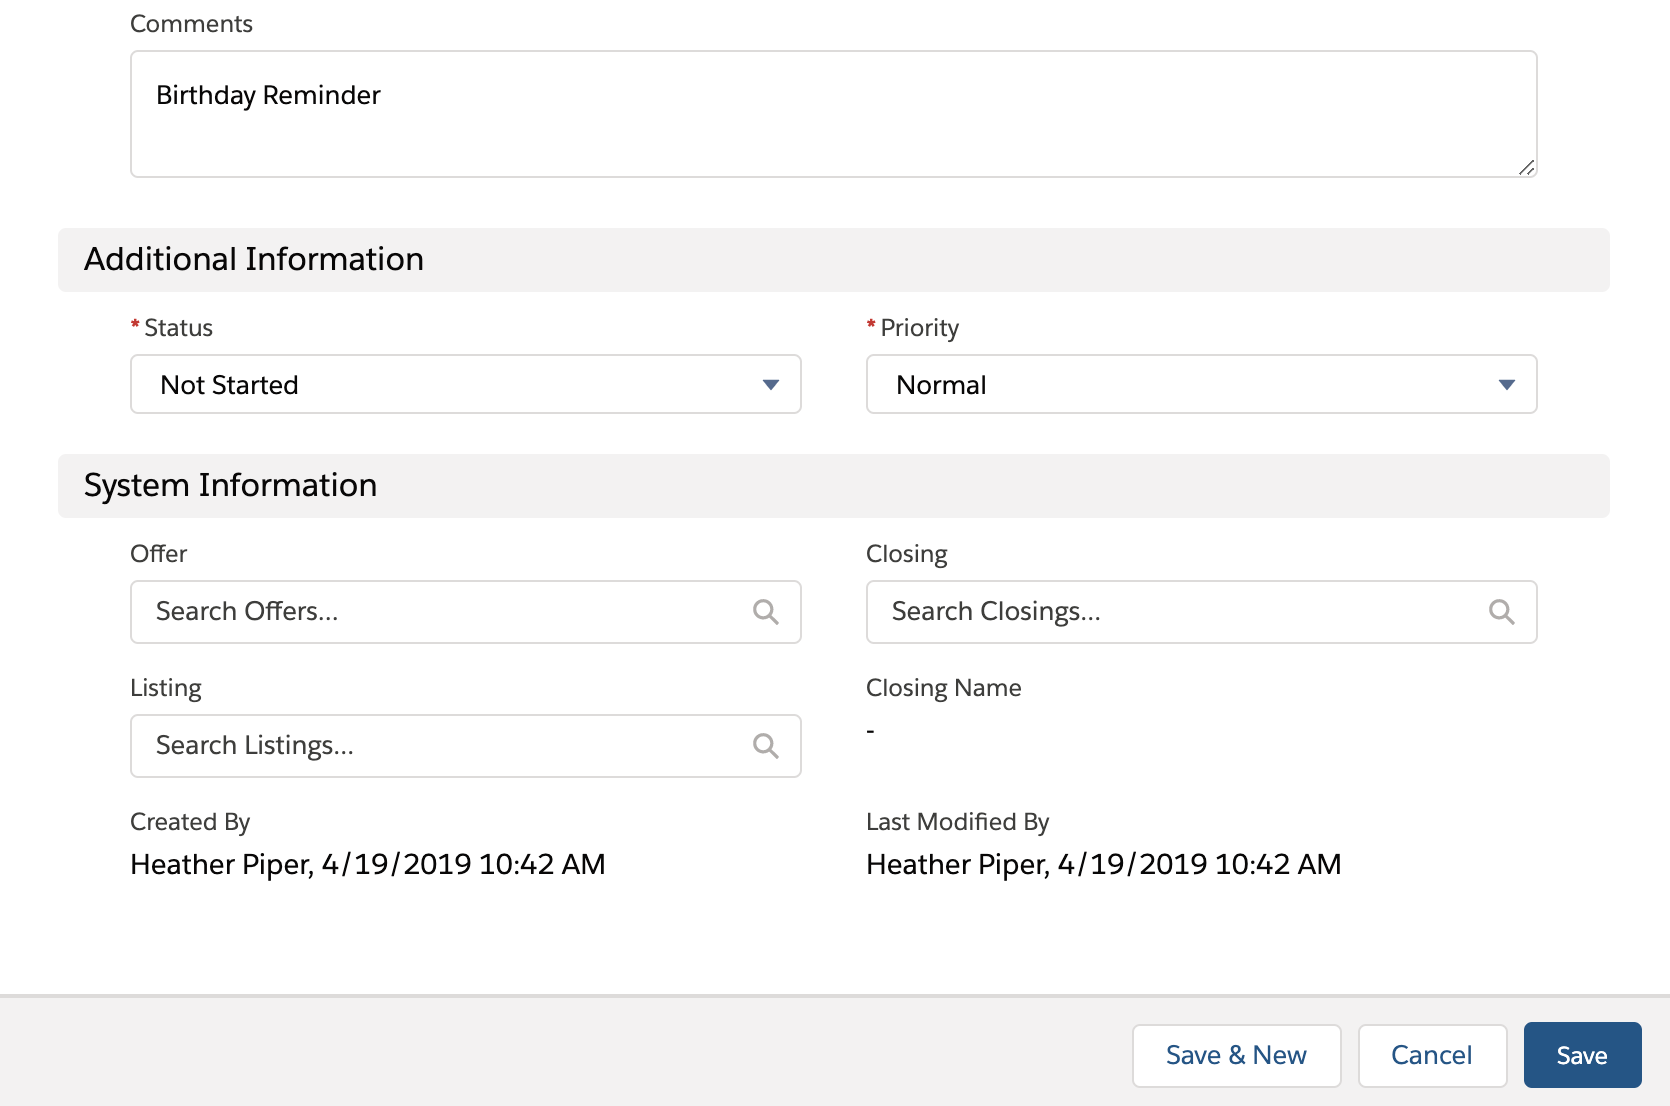
Once you are done, don't forget to Save!
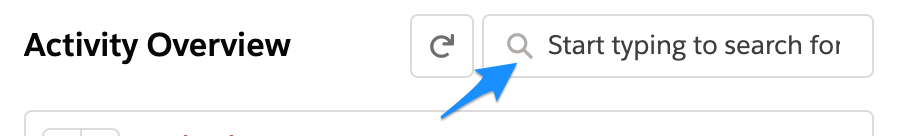
You can also search through tasks with the search bar at the top of the component:
You can choose to display anywhere from 4-10 Tasks per page for this component. If you'd like to change the number of Tasks per page, you would go to Setup and click edit page. Once in edit mode, select the Activity Overview component and on the right side you'll be able to update the number of Tasks desired:

Make sure you save once you're done.
NEW: Last Attempted Contact
New in version 1.640!
Functionality
The Last Attempted Contact Component displays the Last attempted contact for Leads, filtered by Lead Rating. This allows you to easily view your highest rated leads and the last time they were reached out to.

To configure this dashboard component, follow the steps below:
First, you'll need to add this Dashboard Component to the Page Layout of the Home tab. When you are in the Lightning Page Editor of the Home page again, go to the Quickfind Box above the components to the left and enter "PB Last Attempted Contact". That component will show in the lower left (you may have to scroll down), drag and drop that on to the layout and click "Save" in the top right corner to save this recent addition to the page.
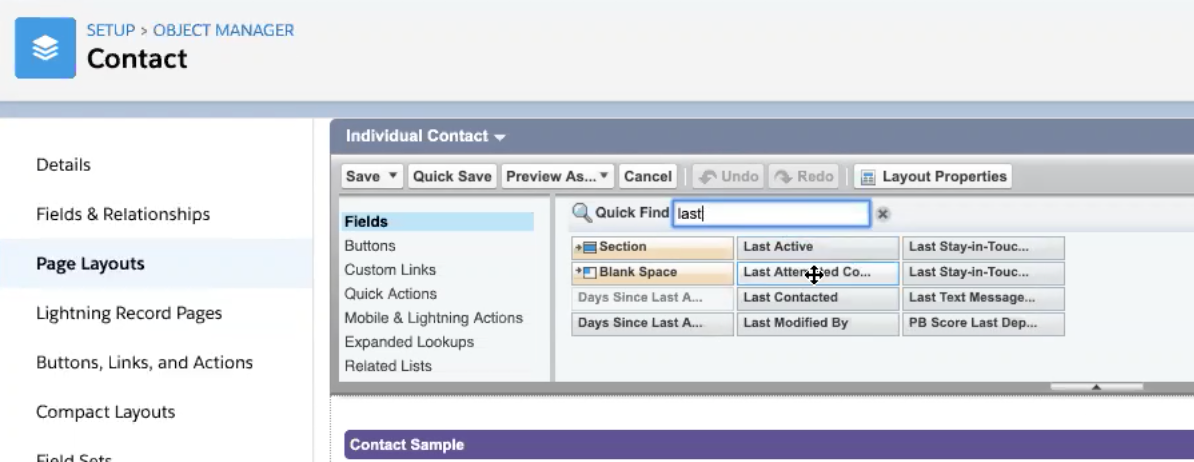
Next, you will want to go back into Object Manager and search for the Contact object. Select the Contact object, then open "Page Layouts" in the menu followed by Individual Contact.
Once on the Page Layout, search for "Last Attempted Contact" in the Drawer's "Quick Find" and drag it down to the Contact Information where you want it to show:
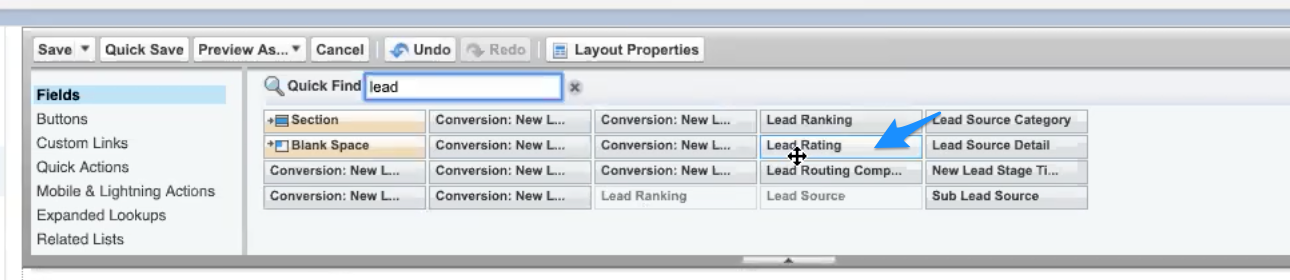
Next, search for the field "Lead Rating" and drag that down to a location of your choice on the Contact Layout as well:
For the next step, go back to Object Manager by clicking on "Object Manager" at the top and search for the "User" object in the overviews Quickfind Box and select User when it shows.
Once the page loaded, select Page Layouts from the menu and then choose "User Layout" from the layouts (should you see more than one, choose the one that is newer or more recently modified. If uncertain, make the following changes to all "User Layouts").
On the User Layout, search for the term "Frequency". You're going to add the fields Frequency A, B, C and D to the layout by dragging each of the four fields down to the "Website" Section and drop them at the bottom (drop them anywhere you like).
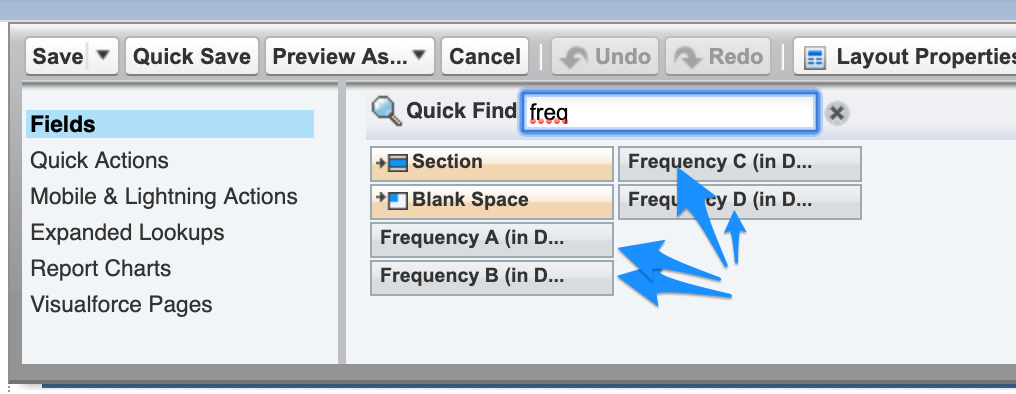
Then, please save the changes to the layout you just made.
You can now navigate back to your home page and you'll see the new Dashboard component has been added. Contained here is a count of the leads that have a Lead Rating on them along with the last attempted contact.
Note: Should you not see any content, your fields "Last Attempted Contact" do not have data in them yet. Please either manually populate them or check if you have active Process Builder Rule named "1.1 Update Contact based off Call Outcomes"
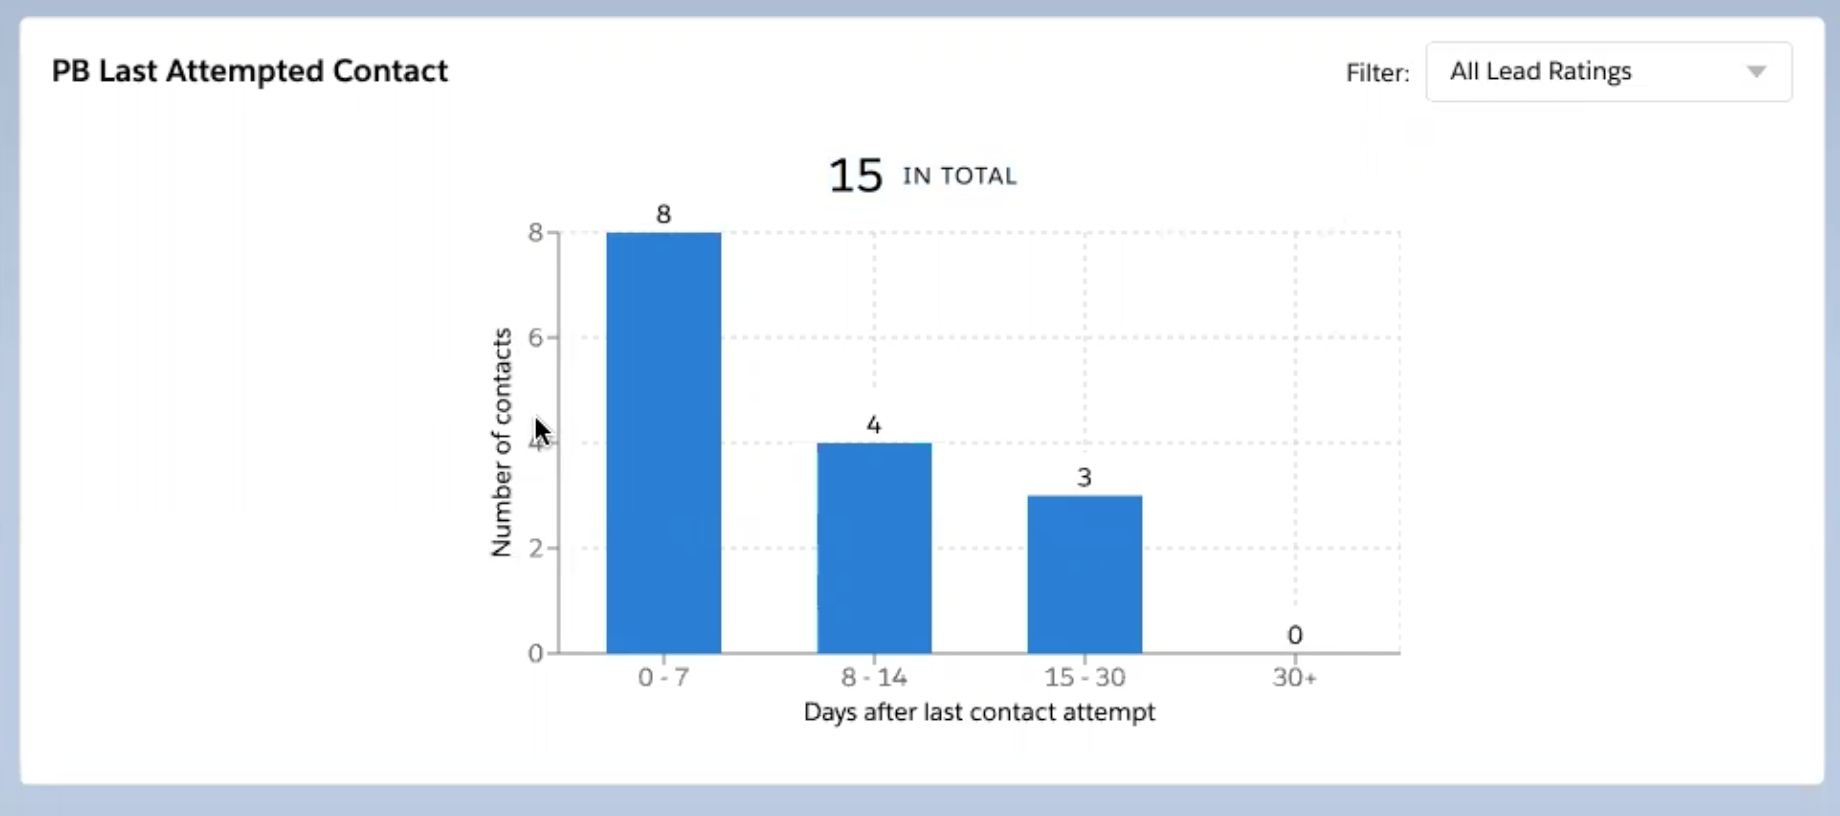

If you click on one of the blue bars from the graph above the display will contain the information about those leads. For example, if I clicked on the 0-7 day bar above, I would be redirected here:

From here you can reach out to the customer(s) directly via email, start a drip campaign, put them in a new or existing static list, etc. You can also adjust the filters for those lists on the left-hand side.
An additional function of this component is
Now you'll need to go to your User Profile in the top right, once that is selected you can again select your User Profile picture:
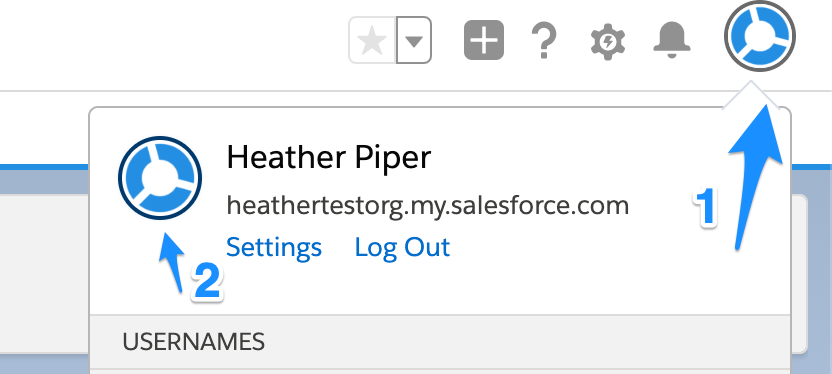
Next, you'll go to User Detail:

Next, you'll go to Edit and scroll down to Website Information and you'll see the four Frequencies you had added to the Page Layout earlier:

Here you can specify the length of the frequency duration days per your preference. Updating these and saving will change the engagement times on the component.
Now you are ready to start using the Last Attempted Contact component!
NEW: PB Follow-up Calendar
New in version 1.640!
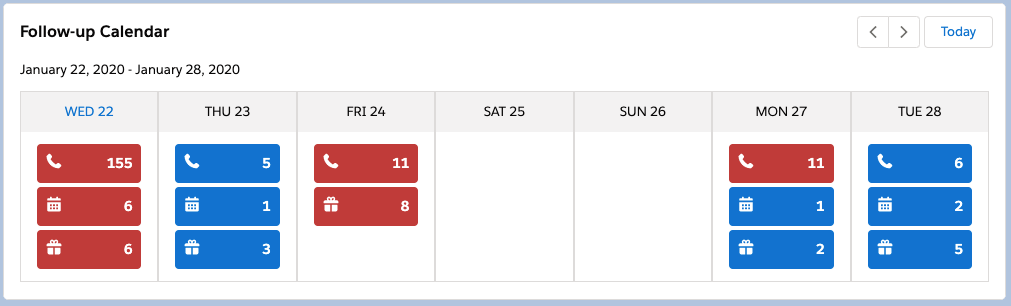
Functionality
This component shows a summarized view of the important dates for the next 7 days (Contacts with Birthdays, Events and Contacts with Next Follow-up Dates) in a calendar view.
When you select a specific summary, you will be provided with a list of those specific contacts or events for that day. For instance, if you selected birthdays in the component, you would get a list of birthdays for the day:
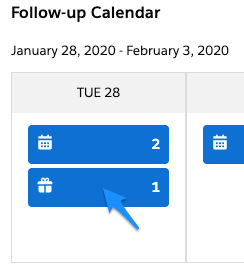
Then you'll see:
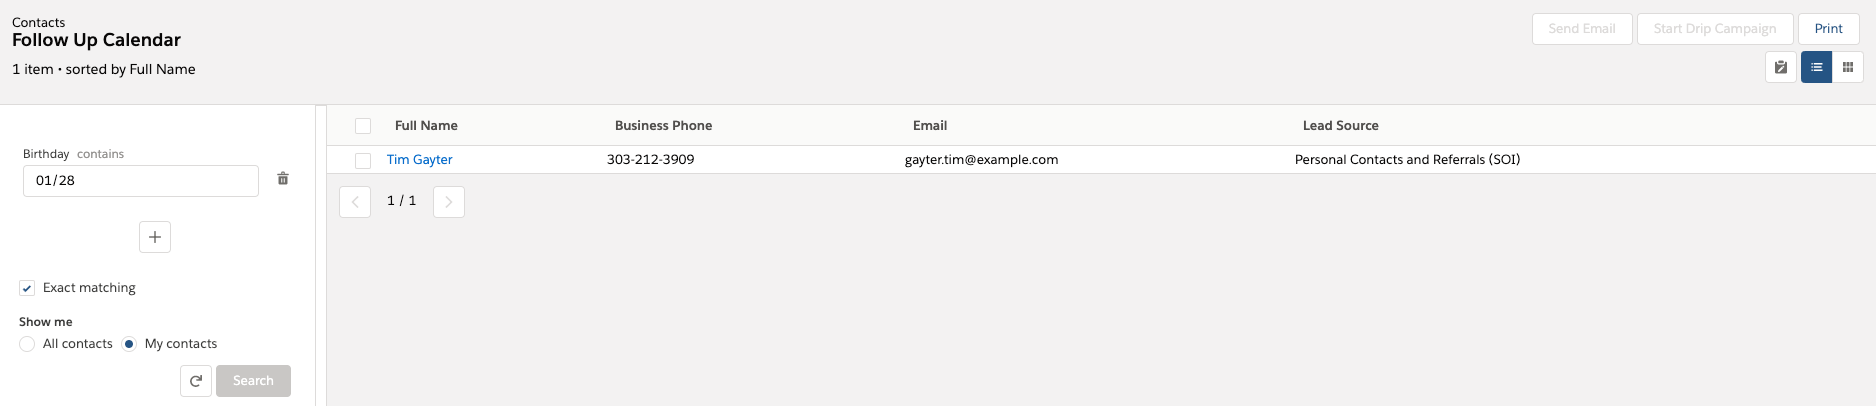
By selecting the checkbox by a contact(s) name and using the dropdown on the left you can add them to a current or new static list or above that you can Send Email or Send Drip Campaign:
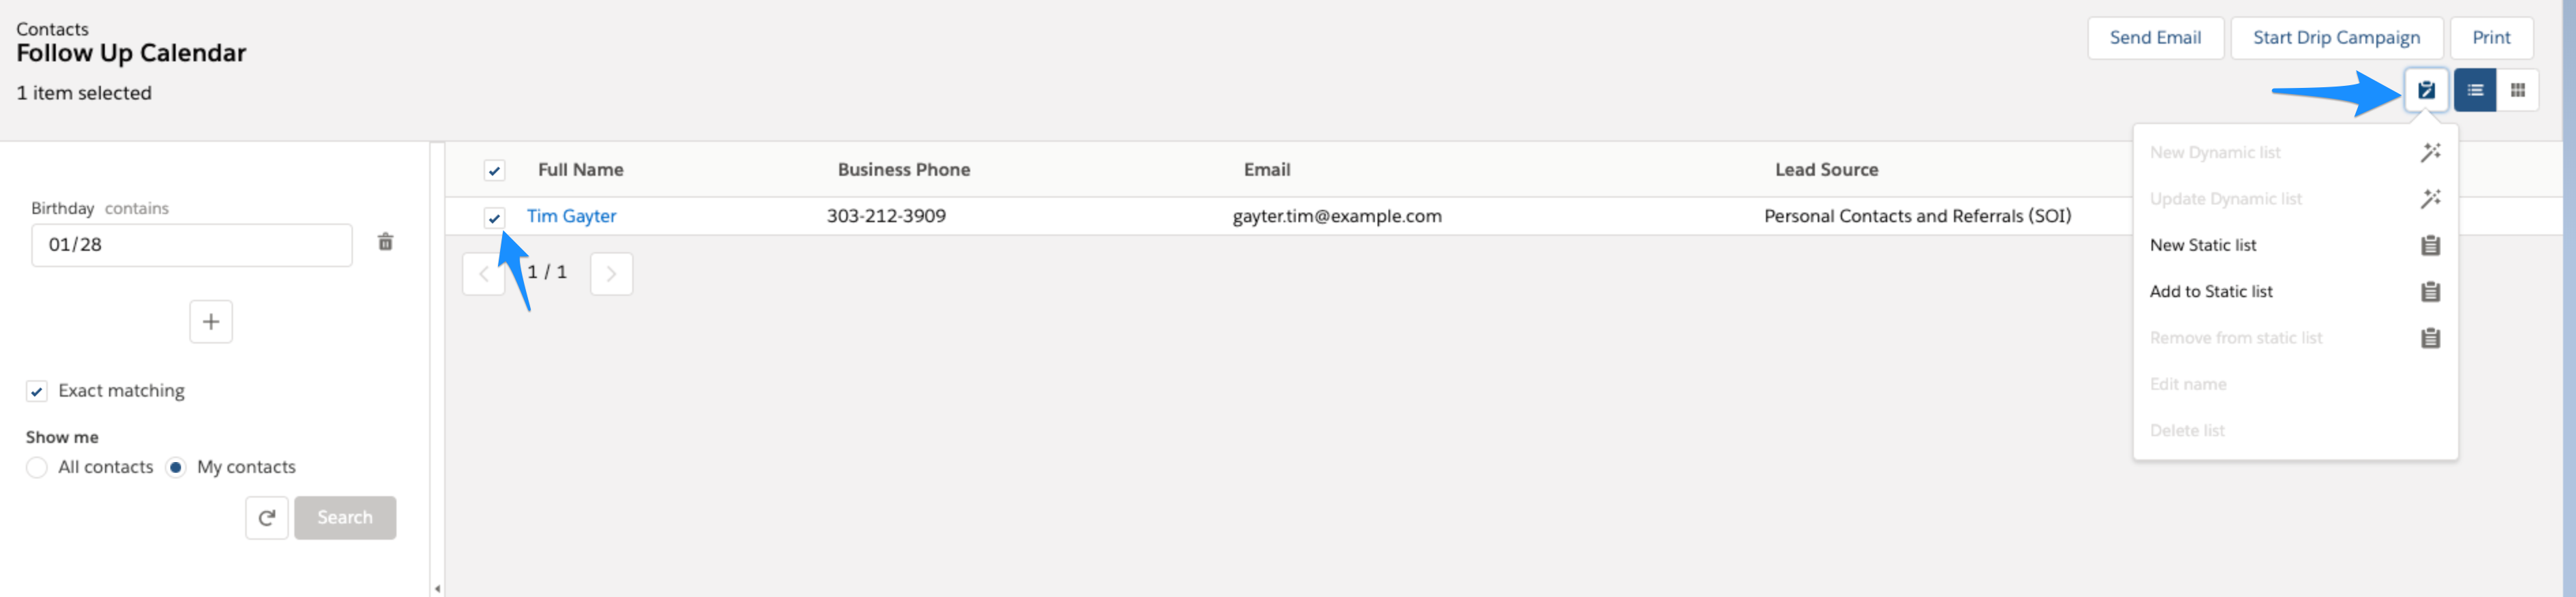
Or you can change the filter on the left side.
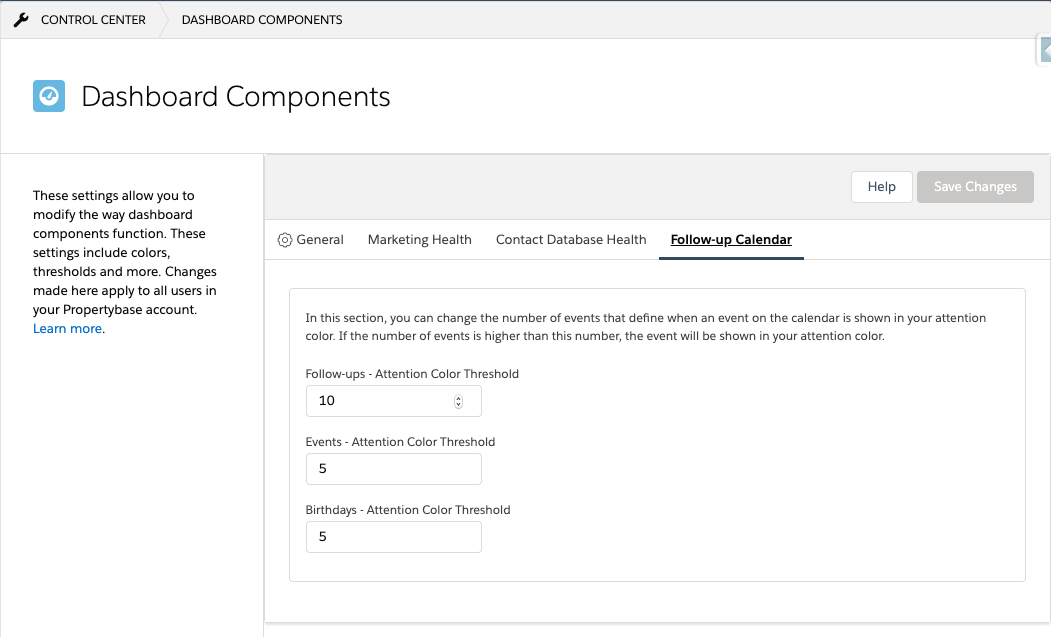
Threshold
You can configure the threshold for this component in the control center by going to: "Dashboard Components" and then to the tab "Follow-up Calendar". In here you can select when an event summary should be shown in the attention color.
Comments
0 comments
Please sign in to leave a comment.