Creating a Report with Propertybase (Classic) Follow
What are reports in Propertybase?
A report is a list of records that meet the criteria you define. It’s displayed in Salesforce in rows and columns, and can be filtered, grouped, or displayed in a graphical chart.
Every report is stored in a folder. Folders can be public, hidden, or shared, and can be set to read-only or read/write. You control who has access to the contents of the folder based on roles, permissions, public groups, and license types. You can make a folder available to your entire organization, or make it private so that only the owner has access.
Reports are a key way to measure your business. Propertybase includes the power of the Force.com based reporting suite. Using the features of this reporting suite you can report on any object from within Propertybase.
Why are reports important?
Using the reporting functionality built into Propertybase allows you to quickly measure all areas of your business. The report builder allows you to easily and efficiently edit and build new reports, to keep up with your ever-changing business environment.
Report Builder:
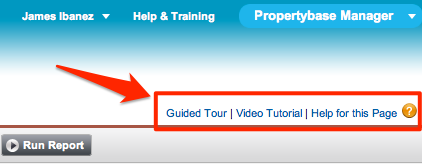
There are three (3) main sections to the report builder, that facilitate building your customized reports. When in the Reports tab, there is a Video Tutorial link at the top right of the page. We strongly recommend becoming familiar with the information provided in the video.

- Field Section - Here, all fields available for generating a report are displayed. Simply use the 'Quick find' search to scan through the fields, by typing the field name you would like in your report. Then drag and drop the field into the 'Preview' section.
- Preview Section - This is a preview of how your report will look. It can display up to 50 records, so don't get discouraged if all the data isn't available. You can use the the drag and drop feature to move your fields into the correct position. Within this section the report format can be selected, as well as the ability to show/hide details of the report.
- Filter Section - Filters can be added to specify the criteria of the data needed in the report. For example, filter contacts by a specific state, city, or status. Display information from the entire company, or just your the records you own by selecting from the 'Show' drop-down. It is also possible to filter records by date range, using the 'Date Field', and selecting either a pre-defined range from the 'Range' drop-down, or selecting your own 'From/To' date range.
Report Formats:
- Tabular - Similar to a spreadsheet type document, the data will be displayed in a column/row fashion. These are good for displaying data in lists.
- Summary - Allows for grouping of rows based on specific fields, adding formulas to sum up subtotals, min's and max's of currency or number fields. This format can be used as a source report for the dashboard.
- Matrix - Allows for reports summarized by row and by column. A good report for comparing related totals and values, and can also be used as a source report for the dashboard.
- Joined - Allows for creation of a report across objects, by adding up to 5 blocks with different sets of data into one report. Each block can be treated as its own mini-'report' by filtering, sorting and adding fields.
For more detailed information on reports please see the Help and Training section found at the top right of your screen


Comments
0 comments
Article is closed for comments.